編輯:關於Android編程
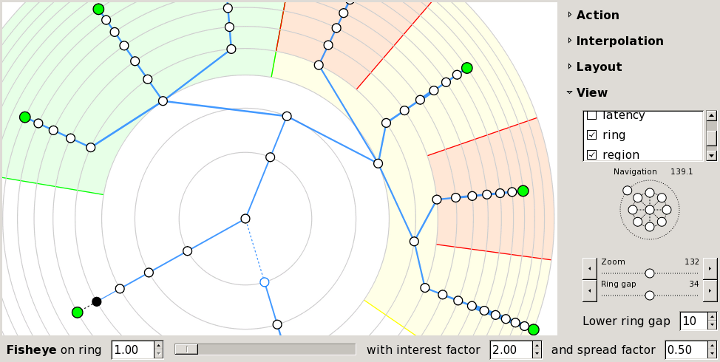
Zenmap's“Topology”tab provides an interactive, animated visualization of the connections between hosts on a network. Hosts are shown as nodes on a graph that extends radially from the center. Click and drag to pan the display, and use the controls provided to zoom in and out. Click on a host and it becomes the new center. The graph rearranges itself in a smooth animation to reflect the new view of the network. Run a new scan and every new host and network path will be added to the topology automatically.
The topology view is most useful when combined with Nmap's--tracerouteoption, because that's the option that discovers the network path to a host. You can view a network inventory that doesn't have traceroute information in the topology, but network paths will not be visible. Remember, though, that you can add traceroute information to a network inventory just by running another scan thanks to Zenmap's scan aggregation.
Initially the topology is shown from the point of view of localhost, with you at the center. Click on a host to move it to the center and see what the network looks like from its point of view.
The topology view is an adaptation of the RadialNetprogram by Jo?o Paulo S.Medeiros.
The topology view uses many symbols and color conventions. This section explains what they mean.


Each regular host in the network is represented by a little circle. The color and size of the circle is determined by the number of open ports on the host. The more open ports, the larger the circle. A white circle represents an intermediate host in a network path that was not port scanned. If a host has fewer than three open ports, it will be green; between three and six open ports, yellow; more than six open ports, red.


If a host is a router, switch, or wireless access point, it is drawn with a square rather than a circle.

Network distance is shown as concentric gray rings. Each additional ring signifies one more network hop from the center host.


Connections between hosts are shown with colored lines. Primary traceroute connections are shown with blue lines. Alternate paths (paths between two hosts where a different path already exists) are drawn in orange. Which path is primary and which paths are alternates is arbitrary and controlled by the order in which paths were recorded. The thickness of a line is proportional to its round-trip time; hosts with a higher RTT have a thicker line. Hosts with no traceroute information are clustered around localhost, connected with a dashed black line.

If there is no RTT for a hop (a missing traceroute entry), the connection is shown with a blue dashed line and the unknown host that makes the connection is shown with a blue outline.
Some special-purpose hosts may carry one or more icons describing what type of host they are:
 A router.
 A switch.
 A wireless access point.
 A firewall.
 A host with some ports filtered.
The controls appear in a column when the“Controls”button is clicked. The controls are divided into sections.
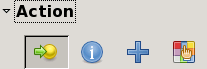
The controls in the“Action”section control what happens when you click on a host. The buttons in this section are, from left to right,“Change focus”,“Show information”,“Group children”, and“Fill region”. When the mode is“Change focus”, clicking on a host rearranges the display to put the selected host at the center. When the mode is“Show information”, clicking on a host brings up a window with information about it.
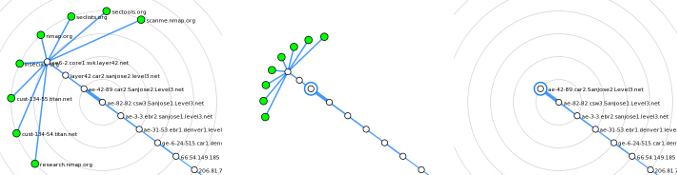
When the mode is“Group children”, clicking a host collapses into it all of its children—those nodes that are farther from the center. When a host is grouped it appears thus: . Clicking on a grouped node ungroups it again. This diagram shows the process of grouping.
Figure12.7.Grouping a host's children
When the mode is“Fill region”, clicking a host highlights the region of the display occupied by the host and its children. The highlighted hosts are exactly the same as those that would be grouped in“Group children”mode. You can choose different colors to highlight different regions. This diagram shows an example of several regions highlighted in different colors.
Figure12.8.Highlighting regions of the topology
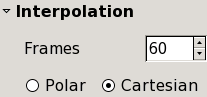
The controls in the“Interpolation”section control how quickly the animation proceeds when part of the graph changes.
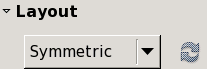
There are two options for the automatic layout of nodes. Symmetric mode gives each subtree of a host an equal-sized slice of the graph. It shows the network hierarchy well but hosts far from the center can be squeezed close together. Weighted mode gives hosts with more children a larger piece of the graph.
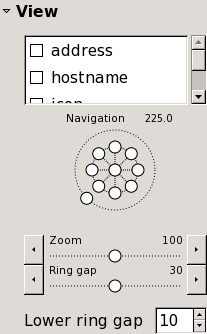
The checkboxes in the“View”section enable and disable parts of the display. For example, disable“hostname”to show only an IP address for each host, or disable“address”to use no labels at all. The“latency”option enables and disables the display of the round-trip times to each host, as determined by Nmap's--tracerouteoption. If“slowin/out”is checked, the animation will not be linear, but will go faster in the middle of the animation and slower at the beginning and end.
The compass-like widget pans the screen in eight directions. Click the center to return to the center host. The ring around the outside controls the rotation of the entire graph.
“Zoom”and“Ring gap”both control the overall size of the graph.“Zoom”changes the size of everything—hosts, labels, connecting lines.“Ring gap”just increases the spacing between the concentric rings, keeping everything else the same size.“Lower ring gap”gives a minimum spacing for the rings, useful mainly when fisheye is enabled.

The fisheye controls give more space to a selected ring, compressing all the others. The slider controls which ring gets the most attention. The“interest factor”is how many times greater the ring spacing is for the chosen ring than it would be with no fisheye. The“spread factor”ranges from ?1to1. It controls how many adjacent rings are expanded around the selected ring, with higher numbers meaning more spread.
The topology display recognizes these keyboard shortcuts:
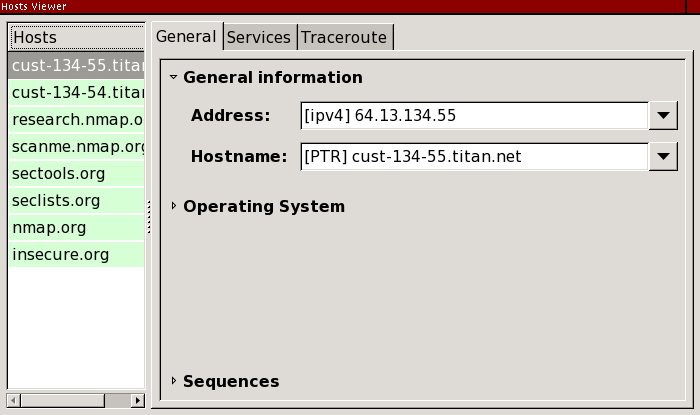
The host viewer is an alternative way to get details about hosts. Activate the viewer by clicking the“Hosts Viewer”button. All the hosts in the inventory are presented in a list. Select any host to get details about it.
 Android--幀動畫
講解一遍如何制作空心心形到實心心形的過渡動畫,然後講解與之反向的動畫。效果如下:圖片序列幀動畫的原理很簡單:就像老式電影膠卷那樣,快速掠過一些列的圖片,“幀&
 Android 網絡學習之使用多線程下載,支持斷點續傳
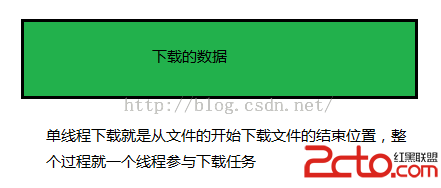
既然本節是學習如何使用多線程下載,那我們先要明白什麼是多線程下載,在搞明白什麼是多線程下載之前,需要先知道什麼是單線程下載。上圖就是說明了單線程下載的原來,因此單線程下載
 Android注解ButterKnife的基本使用
ButterKnife的最新版本是8.4.0。首先,需要導入ButterKnife的jar包。在AndroidStudio中,File->Project Struc
 Android編寫簡單的網絡爬蟲
一、網絡爬蟲的基本知識網絡爬蟲通過遍歷互聯網絡,把網絡中的相關網頁全部抓取過來,這體現了爬的概念。爬蟲如何遍歷網絡呢,互聯網可以看做是一張大圖,每個頁面看做其中的一個節點