編輯:Android開發實例
繪制一個XY集是一種很常見的任務,基於Android平台的繪制很簡單,它讓所有的GUI在XML中定義的(雖然它也可以通過代碼創建)模型是相當不錯的。大部分的圖形處理一個樣本查看,但在大多數情況下,圖應該是一個部分的實施走上屏幕布局XML定義為一所以在這裡展示我們ImageView布局對象。
在Android環境中,有一整套程序的圖形通常是位圖實現像素,Canvas是用來繪制位圖的畫布,通過這一點我們可以得出元(文字,線條等)它描述了漆的顏色,款式等。
下面是效果圖
圖形界面我們通過Xml定義。
1.XML的GUI布局
- <?xml version="1.0" encoding="utf-8"?>
- <TableLayout
- xmlns:android="http://schemas.android.com/apk/res/android"
- android:layout_height="fill_parent"
- android:layout_width="fill_parent"
- android:background="#4B088A">
- <TableRow android:layout_width="fill_parent"
- android:layout_height="wrap_content"
- android:padding="20px">
- <TextView
- android:id="@+id/some"
- android:layout_width="fill_parent"
- android:layout_height="wrap_content"
- android:text="Some layout items here"
- android:layout_marginLeft="10px"
- android:layout_marginRight="10px"
- android:textColor="#ff8000"
- android:textStyle="bold"
- />
- </TableRow>
- <View
- android:layout_width="fill_parent"
- android:layout_height="1dip"
- android:background="#FFE6E6E6"
- />
- <TableRow>
- <ImageView
- android:id="@+id/testy_img"
- android:layout_marginLeft="20px"
- android:padding="20px"
- />
- </TableRow>
- <View
- android:layout_width="fill_parent"
- android:layout_height="1dip"
- android:background="#FFE6E6E6" />
- <TableRow android:layout_width="fill_parent"
- android:layout_height="wrap_content"
- android:padding="20px">
- <TextView
- android:id="@+id/more"
- android:layout_width="fill_parent"
- android:layout_height="wrap_content"
- android:text="More layout items here"
- android:layout_marginLeft="10px"
- android:layout_marginRight="10px"
- android:textColor="#ff8000"
- android:textStyle="bold"
- />
- </TableRow>
- </TableLayout>
這個布局文件是TableLayout布局,它定義了三行,行之間通過一條線割開
2.圖表的實現
為了實現我們的圖表,我們首先創建一個位圖,然後關聯到我們的布局文件,有了位圖,我們就可以繪制圖表,做縮放,色彩和數據顯示 等效果。
2.1繪制位圖
首先我們使布局連接到XML對象的,那麼我們創建位圖。我們通過quicky_XY方法來實現所有的繪制,最後顯示在屏幕上。
- public void onCreate(Bundle savedInstanceState) {
- super.onCreate(savedInstanceState);
- setContentView(R.layout.main);
- ImageView image = (ImageView) findViewById(R.id.testy_img);
- Bitmap emptyBmap = Bitmap.createBitmap(250, 200, Config.ARGB_8888);
- int width = emptyBmap.getWidth();
- int height = emptyBmap.getHeight();
- Bitmap charty = Bitmap.createBitmap(width, height,
- Bitmap.Config.ARGB_8888);
- charty = quicky_XY(emptyBmap);
- image.setImageBitmap(charty);
- }
2.2繪制網格
有了位圖後,將它與Canvas相關聯
Canvas canvas = new Canvas(bitmap)
然後將所有的元素繪制到Canvas上,我們需要定義一些用於放置標簽和數據點空間的網格。
- public static void draw_the_grid(Canvas this_g, Vector these_labels) {
- double rounded_max = 0.0;
- double rounded_min = 0.0;
- double rounded_max_temp;
- Object curElt;
- String[] cur_elt_array;
- int left_margin_d, right_margin_d;
- if (draw_only_this_idx == -1)
- curElt = these_labels.elementAt(0); // default it to 1st one if non
- // set
- else
- curElt = these_labels.elementAt(draw_only_this_idx); // now just the
- // 1st elt
- cur_elt_array = (String[]) curElt;
- rounded_max = get_ceiling_or_floor(
- Double.parseDouble(cur_elt_array[2]), true);
- rounded_min = get_ceiling_or_floor(
- Double.parseDouble(cur_elt_array[3]), false);
- // ok so now we have the max value of the set just get a cool ceiling
- // and we go on
- final Paint paint = new Paint();
- paint.setTextSize(15);
- left_margin_d = getCurTextLengthInPixels(paint, Double
- .toString(rounded_max));
- // keep the position for later drawing -- leave space for the legend
- int p_height = 170;
- int p_width = 220;
- int[] tmp_draw_sizes = { 2 + left_margin_d, 25,
- p_width - 2 - left_margin_d, p_height - 25 - 5 };
- drawSizes = tmp_draw_sizes; // keep it for later processing
- // with the mzrgins worked out draw the plotting grid
- paint.setStyle(Paint.Style.FILL);
- paint.setColor(Color.WHITE);
- // Android does by coords
- this_g
- .drawRect(drawSizes[0], drawSizes[1], drawSizes[0]
- + drawSizes[2], drawSizes[1] + drawSizes[3], paint);
- paint.setColor(Color.GRAY);
- // finally draw the grid
- paint.setStyle(Paint.Style.STROKE);
- this_g
- .drawRect(drawSizes[0], drawSizes[1], drawSizes[0]
- + drawSizes[2], drawSizes[1] + drawSizes[3], paint);
- for (int i = 1; i < 5; i++) {
- this_g.drawLine(drawSizes[0],
- drawSizes[1] + (i * drawSizes[3] / 5), drawSizes[0]
- + drawSizes[2], drawSizes[1]
- + (i * drawSizes[3] / 5), paint);
- this_g.drawLine(drawSizes[0] + (i * drawSizes[2] / 5),
- drawSizes[1], drawSizes[0] + (i * drawSizes[2] / 5),
- drawSizes[1] + drawSizes[3], paint);
- }
- // good for one value
- print_axis_values_4_grid(this_g, cur_elt_array[1], Double
- .toString(rounded_max), Double.toString(rounded_min),
- cur_elt_array[0], 2, 0);
- } // --- end of draw_grid ---
2.3繪圖和縮放
這些數據點需要一到屏幕上的坐標數據范圍正確的映射遍歷數據點和調用drawLine接連兩個點會完成我們的圖表。數據點通過數據為載體,現在將調用plot_array_list
- private static Point scale_point(int this_x , double this_y , Point drawPoint ,
- int scr_x , int scr_y , int scr_width , int src_height ,
- double maxX , double minX , double maxY , double minY )
- {
- int temp_x, temp_y;
- Point temp = new Point();
- if (maxY == minY) //skip bad data
- return null;
- //don't touch it if is nothing
- try
- {
- temp_x = scr_x + (int)( ((double)this_x - minX) *
- ((double)scr_width / (maxX - minX)) );
- temp_y = scr_y + (int)( (maxY - this_y) *
- ((double)src_height / (maxY - minY)) );
- temp.x = temp_x;
- temp.y= temp_y;
- drawPoint = temp;
- }
- catch (Exception e)
- {
- return (null);
- }
- return temp;
- } // --- end of scale_point --
- public static boolean plot_array_list(Canvas this_g, Vector this_array_list ,
- Vector these_labels , String this_title , int only_this_idx )
- {
- int idx;
- int lRow ;
- int nParms;
- int i, points_2_plot, shifted_idx ;
- int prev_x, prev_y ;
- int cur_x=0, cur_y=0 ;
- //Dim ShowMarker As Object
- Point cur_point = new Point();
- cur_point.set(0,0);
- double cur_maxX, cur_minX, cur_maxY=20, cur_minY=0, cur_rangeY;
- int cur_start_x, cur_points_2_plot;
- int POINTS_TO_CHANGE = 30;
- double cur_OBD_val;
- //Object curElt;
- String curElt;
- String[] cur_elt_array;
- Object curElt2;
- String[] cur_elt_array2;
- final Paint paint = new Paint();
- try // catch in this block for some thing
- {
- points_2_plot = this_array_list.size();
- {
- cur_start_x = 0;
- cur_points_2_plot = points_2_plot;
- cur_maxX = cur_points_2_plot;
- cur_minX = 0;
- }
- //'Create the plot points for this series from the ChartPoints array:
- curElt = (String)this_array_list.elementAt(0);
- //the lines have to come out good
- paint.setStyle(Paint.Style.STROKE);
- //
- //for( nParms = 0 ; nParms < cur_elt_array.length ; nParms++ )
- nParms = only_this_idx;
- {
- //get cur item labels
- curElt2 = these_labels.elementAt(nParms);
- cur_elt_array2 = (String[]) curElt2;
- cur_maxY = get_ceiling_or_floor
- (Double.parseDouble(cur_elt_array2[2]) , true);
- cur_minY = get_ceiling_or_floor
- (Double.parseDouble(cur_elt_array2[3]) , false);
- cur_points_2_plot = this_array_list.size();
- cur_maxX = cur_points_2_plot;
- curElt = (String)this_array_list.elementAt(0);
- cur_OBD_val = Double.parseDouble( curElt);
- cur_point = scale_point(0, cur_OBD_val, cur_point,
- drawSizes[0], drawSizes[1], drawSizes[2], drawSizes[3],
- cur_maxX, cur_minX, cur_maxY,
- cur_minY); //'(CInt(curAxisValues.Mins(nParms - 2) / 5) + 1) * 5)
- cur_x = cur_point.x;
- cur_y = cur_point.y;
- paint.setColor(Color.GREEN);
- // the point is only cool when samples are low
- if ( cur_points_2_plot < POINTS_TO_CHANGE)
- this_g.drawRect(cur_x-2, cur_y-2, cur_x-2 + 4,
- cur_y-2+ 4 , paint);
- prev_x = cur_x;
- prev_y = cur_y;
- //'go and plot point for this parm -- pont after the 1st one
- for (lRow = cur_start_x +1 ; lRow< cur_start_x +
- cur_points_2_plot -1 ; lRow++)
- {
- curElt = (String)this_array_list.elementAt(lRow);
- cur_OBD_val = Double.parseDouble( curElt);
- //'work out an approx if cur Y values not avail(e.g. nothing)
- // if (! (cur_elt_array[nParms ] == null ) ) //skip bad one
- if( cur_OBD_val == Double.NaN) continue; //skip bad one
- {
- cur_point=scale_point(lRow, cur_OBD_val, cur_point,
- drawSizes[0], drawSizes[1],
- drawSizes[2], drawSizes[3],
- cur_maxX, cur_minX, cur_maxY, cur_minY);
- cur_x = cur_point.x;
- cur_y = cur_point.y;
- if ( cur_points_2_plot < POINTS_TO_CHANGE)
- this_g.drawRect(cur_x-2, cur_y-2, cur_x-2 +4,
- cur_y-2 + 4, paint );
- this_g.drawLine( prev_x, prev_y, cur_x, cur_y, paint);
- prev_x = cur_x;
- prev_y = cur_y;
- } // ' if end of this_array(lRow, nParms - 1)<> nothing
- } // end of for lrow
- } // end of for nParmns
- //this_g.invalidate();
- return( true);
- }
- catch (Exception e)
- {
- return( false);
- }
- } // --- end of plot_array_list --
Java完整代碼:
- package com.wjq.chart;
- import java.util.Vector;
- import android.app.Activity;
- import android.graphics.Bitmap;
- import android.graphics.Canvas;
- import android.graphics.Color;
- import android.graphics.Paint;
- import android.graphics.Point;
- import android.graphics.Rect;
- import android.graphics.RectF;
- import android.graphics.Typeface;
- import android.graphics.Bitmap.Config;
- import android.graphics.Paint.FontMetrics;
- import android.os.Bundle;
- import android.widget.ImageView;
- public class Main extends Activity {
- static int draw_only_this_idx = -1;
- static int[] drawSizes;
- @Override
- public void onCreate(Bundle savedInstanceState) {
- super.onCreate(savedInstanceState);
- setContentView(R.layout.main);
- ImageView image = (ImageView) findViewById(R.id.testy_img);
- Bitmap emptyBmap = Bitmap.createBitmap(250, 200, Config.ARGB_8888);
- int width = emptyBmap.getWidth();
- int height = emptyBmap.getHeight();
- Bitmap charty = Bitmap.createBitmap(width, height,
- Bitmap.Config.ARGB_8888);
- charty = quicky_XY(emptyBmap);
- image.setImageBitmap(charty);
- }
- public static Bitmap quicky_XY(Bitmap bitmap) {
- // xode to get bitmap onto screen
- Bitmap output = Bitmap.createBitmap(bitmap.getWidth(), bitmap
- .getHeight(), Config.ARGB_8888);
- Canvas canvas = new Canvas(output);
- final int color = 0xff0B0B61;
- final Paint paint = new Paint();
- final Rect rect = new Rect(0, 0, bitmap.getWidth(), bitmap.getHeight());
- final RectF rectF = new RectF(rect);
- final float roundPx = 12;
- // get the little rounded cornered outside
- paint.setAntiAlias(true);
- canvas.drawARGB(0, 0, 0, 0);
- paint.setColor(color);
- canvas.drawRoundRect(rectF, roundPx, roundPx, paint);
- // ---- NOw just draw on this bitmap
- // Set the labels info manually
- String[] cur_elt_array = new String[4];
- cur_elt_array[0] = "Voltage";
- cur_elt_array[1] = "volts";
- cur_elt_array[2] = "93"; // max
- cur_elt_array[3] = "0"; // min
- Vector labels = new Vector();
- labels.add(cur_elt_array);
- draw_the_grid(canvas, labels);
- // se the data to be plotted and we should on our way
- Vector data_2_plot = new Vector();
- data_2_plot.add("0.2");
- data_2_plot.add("1.2");
- data_2_plot.add("9.6");
- data_2_plot.add("83.2");
- data_2_plot.add("44.2");
- data_2_plot.add("20.2");
- data_2_plot.add("16.2");
- plot_array_list(canvas, data_2_plot, labels, "the title", 0);
- canvas.drawBitmap(bitmap, rect, rect, paint);
- return output;
- }
- public static void draw_the_grid(Canvas this_g, Vector these_labels) {
- double rounded_max = 0.0;
- double rounded_min = 0.0;
- double rounded_max_temp;
- Object curElt;
- String[] cur_elt_array;
- int left_margin_d, right_margin_d;
- if (draw_only_this_idx == -1)
- curElt = these_labels.elementAt(0); // default it to 1st one if non
- // set
- else
- curElt = these_labels.elementAt(draw_only_this_idx); // now just the
- // 1st elt
- cur_elt_array = (String[]) curElt;
- rounded_max = get_ceiling_or_floor(
- Double.parseDouble(cur_elt_array[2]), true);
- rounded_min = get_ceiling_or_floor(
- Double.parseDouble(cur_elt_array[3]), false);
- // ok so now we have the max value of the set just get a cool ceiling
- // and we go on
- final Paint paint = new Paint();
- paint.setTextSize(15);
- left_margin_d = getCurTextLengthInPixels(paint, Double
- .toString(rounded_max));
- // keep the position for later drawing -- leave space for the legend
- int p_height = 170;
- int p_width = 220;
- int[] tmp_draw_sizes = { 2 + left_margin_d, 25,
- p_width - 2 - left_margin_d, p_height - 25 - 5 };
- drawSizes = tmp_draw_sizes; // keep it for later processing
- // with the mzrgins worked out draw the plotting grid
- paint.setStyle(Paint.Style.FILL);
- paint.setColor(Color.WHITE);
- // Android does by coords
- this_g
- .drawRect(drawSizes[0], drawSizes[1], drawSizes[0]
- + drawSizes[2], drawSizes[1] + drawSizes[3], paint);
- paint.setColor(Color.GRAY);
- // finally draw the grid
- paint.setStyle(Paint.Style.STROKE);
- this_g
- .drawRect(drawSizes[0], drawSizes[1], drawSizes[0]
- + drawSizes[2], drawSizes[1] + drawSizes[3], paint);
- for (int i = 1; i < 5; i++) {
- this_g.drawLine(drawSizes[0],
- drawSizes[1] + (i * drawSizes[3] / 5), drawSizes[0]
- + drawSizes[2], drawSizes[1]
- + (i * drawSizes[3] / 5), paint);
- this_g.drawLine(drawSizes[0] + (i * drawSizes[2] / 5),
- drawSizes[1], drawSizes[0] + (i * drawSizes[2] / 5),
- drawSizes[1] + drawSizes[3], paint);
- }
- // good for one value
- print_axis_values_4_grid(this_g, cur_elt_array[1], Double
- .toString(rounded_max), Double.toString(rounded_min),
- cur_elt_array[0], 2, 0);
- } // --- end of draw_grid ---
- private static Point scale_point(int this_x, double this_y,
- Point drawPoint, int scr_x, int scr_y, int scr_width,
- int src_height, double maxX, double minX, double maxY, double minY) {
- int temp_x, temp_y;
- Point temp = new Point();
- if (maxY == minY) // skip bad data
- return null;
- // don't touch it if is nothing
- try {
- temp_x = scr_x
- + (int) (((double) this_x - minX) * ((double) scr_width / (maxX - minX)));
- temp_y = scr_y
- + (int) ((maxY - this_y) * ((double) src_height / (maxY - minY)));
- temp.x = temp_x;
- temp.y = temp_y;
- drawPoint = temp;
- } catch (Exception e) {
- return (null);
- }
- return temp;
- } // --- end of scale_point --
- public static boolean plot_array_list(Canvas this_g,
- Vector this_array_list, Vector these_labels, String this_title,
- int only_this_idx) {
- int idx;
- int lRow;
- int nParms;
- int i, points_2_plot, shifted_idx;
- int prev_x, prev_y;
- int cur_x = 0, cur_y = 0;
- // Dim ShowMarker As Object
- Point cur_point = new Point();
- cur_point.set(0, 0);
- double cur_maxX, cur_minX, cur_maxY = 20, cur_minY = 0, cur_rangeY;
- int cur_start_x, cur_points_2_plot;
- int POINTS_TO_CHANGE = 30;
- double cur_OBD_val;
- // Object curElt;
- String curElt;
- String[] cur_elt_array;
- Object curElt2;
- String[] cur_elt_array2;
- final Paint paint = new Paint();
- try // catch in this block for some thing
- {
- points_2_plot = this_array_list.size();
- {
- cur_start_x = 0;
- cur_points_2_plot = points_2_plot;
- cur_maxX = cur_points_2_plot;
- cur_minX = 0;
- }
- // 'Create the plot points for this series from the ChartPoints
- // array:
- curElt = (String) this_array_list.elementAt(0);
- // the lines have to come out good
- paint.setStyle(Paint.Style.STROKE);
- //
- // for( nParms = 0 ; nParms < cur_elt_array.length ; nParms++ )
- nParms = only_this_idx;
- {
- // get cur item labels
- curElt2 = these_labels.elementAt(nParms);
- cur_elt_array2 = (String[]) curElt2;
- cur_maxY = get_ceiling_or_floor(Double
- .parseDouble(cur_elt_array2[2]), true);
- cur_minY = get_ceiling_or_floor(Double
- .parseDouble(cur_elt_array2[3]), false);
- cur_points_2_plot = this_array_list.size();
- cur_maxX = cur_points_2_plot;
- curElt = (String) this_array_list.elementAt(0);
- cur_OBD_val = Double.parseDouble(curElt);
- cur_point = scale_point(0, cur_OBD_val, cur_point,
- drawSizes[0], drawSizes[1], drawSizes[2], drawSizes[3],
- cur_maxX, cur_minX, cur_maxY, cur_minY); // '(CInt(curAxisValues.Mins(nParms
- // - 2) / 5)
- // + 1) * 5)
- cur_x = cur_point.x;
- cur_y = cur_point.y;
- paint.setColor(Color.GREEN);
- // the point is only cool when samples are low
- if (cur_points_2_plot < POINTS_TO_CHANGE)
- this_g.drawRect(cur_x - 2, cur_y - 2, cur_x - 2 + 4,
- cur_y - 2 + 4, paint);
- prev_x = cur_x;
- prev_y = cur_y;
- // 'go and plot point for this parm -- pont after the 1st one
- for (lRow = cur_start_x + 1; lRow < cur_start_x
- + cur_points_2_plot - 1; lRow++) {
- curElt = (String) this_array_list.elementAt(lRow);
- cur_OBD_val = Double.parseDouble(curElt);
- // 'work out an approx if cur Y values not avail(e.g.
- // nothing)
- // if (! (cur_elt_array[nParms ] == null ) ) //skip bad one
- if (cur_OBD_val == Double.NaN)
- continue; // skip bad one
- {
- cur_point = scale_point(lRow, cur_OBD_val, cur_point,
- drawSizes[0], drawSizes[1], drawSizes[2],
- drawSizes[3], cur_maxX, cur_minX, cur_maxY,
- cur_minY);
- cur_x = cur_point.x;
- cur_y = cur_point.y;
- if (cur_points_2_plot < POINTS_TO_CHANGE)
- this_g.drawRect(cur_x - 2, cur_y - 2,
- cur_x - 2 + 4, cur_y - 2 + 4, paint);
- this_g.drawLine(prev_x, prev_y, cur_x, cur_y, paint);
- prev_x = cur_x;
- prev_y = cur_y;
- } // ' if end of this_array(lRow, nParms - 1)<> nothing
- } // end of for lrow
- } // end of for nParmns
- // this_g.invalidate();
- return (true);
- } catch (Exception e) {
- return (false);
- }
- } // --- end of plot_array_list --
- public static void print_axis_values_4_grid(Canvas thisDrawingArea,
- String cur_units, String cur_max, String cur_min, String cur_label,
- int x_guide, int this_idx) {
- String this_str;
- double delta = (Double.valueOf(cur_max).doubleValue() - Double.valueOf(
- cur_min).doubleValue()) / 5;
- final Paint paint = new Paint();
- paint.setColor(Color.WHITE);
- paint.setTypeface(Typeface.SANS_SERIF);
- paint.setTextSize(8);
- for (int i = 0; i < 6; i++) {
- this_str = Double
- .toString((Double.valueOf(cur_min).doubleValue() + delta
- * i));
- final int point = this_str.indexOf('.');
- if (point > 0) {
- // If has a decimal point, may need to clip off after or force 2
- // decimal places
- this_str = this_str + "00";
- this_str = this_str.substring(0, point + 3);
- } else {
- this_str = this_str + ".00";
- }
- if (i == 5) {
- thisDrawingArea.drawText(this_str, x_guide - 2, drawSizes[1]
- + drawSizes[3] - (i * drawSizes[3] / 5), paint);
- } else {
- thisDrawingArea.drawText(this_str, x_guide - 2, drawSizes[1]
- + drawSizes[3] - (i * drawSizes[3] / 5) - 3, paint);
- }
- }
- paint.setTextSize(10);
- switch (this_idx) {
- case 0:
- thisDrawingArea.drawText(" " + cur_label + " - " + cur_units,
- x_guide - 2, drawSizes[1] - 15, paint);
- break;
- default:
- thisDrawingArea.drawText(" " + cur_label + " - " + cur_units,
- x_guide - 2 - 30, drawSizes[1] - 15, paint);
- break;
- }
- }
- private static int getCurTextLengthInPixels(Paint this_paint,
- String this_text) {
- FontMetrics fp = this_paint.getFontMetrics();
- Rect rect = new Rect();
- this_paint.getTextBounds(this_text, 0, this_text.length(), rect);
- return rect.width();
- }
- public static double get_ceiling_or_floor(double this_val, boolean is_max) {
- double this_min_tmp;
- int this_sign;
- int this_10_factor = 0;
- double this_rounded;
- if (this_val == 0.0) {
- this_rounded = 0.0;
- return this_rounded;
- }
- this_min_tmp = Math.abs(this_val);
- if (this_min_tmp >= 1.0 && this_min_tmp < 10.0)
- this_10_factor = 1;
- else if (this_min_tmp >= 10.0 && this_min_tmp < 100.0)
- this_10_factor = 10;
- else if (this_min_tmp >= 100.0 && this_min_tmp < 1000.0)
- this_10_factor = 100;
- else if (this_min_tmp >= 1000.0 && this_min_tmp < 10000.0)
- this_10_factor = 1000;
- else if (this_min_tmp >= 10000.0 && this_min_tmp < 100000.0)
- this_10_factor = 10000;
- // 'cover when min is pos and neg
- if (is_max) {
- if (this_val > 0.0)
- this_sign = 1;
- else
- this_sign = -1;
- } else {
- if (this_val > 0.0)
- this_sign = -1;
- else
- this_sign = 1;
- }
- if (this_min_tmp > 1)
- this_rounded = (double) (((int) (this_min_tmp / this_10_factor) + this_sign) * this_10_factor);
- else {
- this_rounded = (int) (this_min_tmp * 100.0);
- // ' cover same as above bfir number up to .001 less than tha it
- // will skip
- if (this_rounded >= 1 && this_rounded < 9)
- this_10_factor = 1;
- else if (this_rounded >= 10 && this_rounded < 99)
- this_10_factor = 10;
- else if (this_rounded >= 100 && this_rounded < 999)
- this_10_factor = 100;
- this_rounded = (double) (((int) ((this_rounded) / this_10_factor) + this_sign) * this_10_factor);
- this_rounded = (int) (this_rounded) / 100.0;
- }
- if (this_val < 0)
- this_rounded = -this_rounded;
- return this_rounded;
- }
- }
源碼下載:XYChart.rar
 android+json+php+mysql實現用戶反饋功能方法解析
相信每個項目都會有用戶反饋建議等功能,這個實現的方法很多,下面是我實現的方法,供大家交流。首先看具體界面,三個字段。名字,郵箱為選填,可以為空,建議不能為空。如有
 Android實現頂部導航菜單左右滑動效果
這篇文章主要為大家詳細介紹了Android實現頂部導航菜單左右滑動效果,具有一定的參考價值,感興趣的小伙伴們可以參考一下 本文給大家介紹在Android中如何實現頂部導
 Android加載Spinner
可以顯示在的Android任務,通過加載進度條的進展。進度條有兩種形狀。加載欄和加載微調(spinner)。在本章中,我們將討論微調(spinner)。Spinner 用
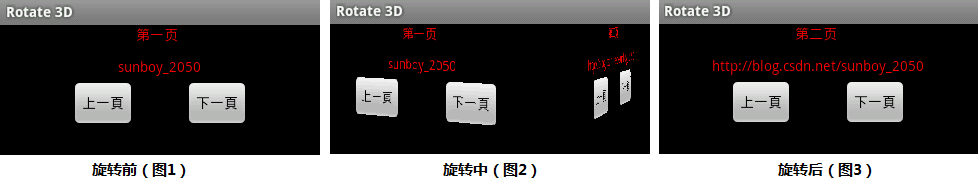 Android編程實現3D滑動旋轉效果的方法
本文實例講述了Android編程實現3D滑動旋轉效果的方法。分享給大家供大家參考,具體如下: 這裡我們通過代碼實現一些滑動翻頁的動畫效果。 Animation實現