編輯:關於Android編程
Android提供了一個名為meminfo的小工具幫助應用分析自身的內存占用,並且在4.4還新增了memtrack HAL模塊,SoC廠商通過實現memtrack模塊,讓meminfo可以獲取GPU相關的一些內存分配狀況。了解meminfo的實現,對我們更深入了解應用的內存占用狀況是很有幫助的。而這篇文章的目的就是分析Android 4.4 meminfo的內部實現源碼,讓開發者通過這些信息可以更了解自己應用的內存占用狀況。
在控制台輸入命令"adb shell dumpsys meminfo YOUR-PACKAGE-NAME",可以看到類似下圖的結果:
** MEMINFO in pid 14120 [com.UCMobile.test] **
                   Pss  Private  Private  Swapped     Heap     Heap     Heap
                 Total    Dirty    Clean    Dirty     Size    Alloc     Free
                ------   ------   ------   ------   ------   ------   ------
  Native Heap   187886   187872        0        0   325232   174093    38594
  Dalvik Heap    24801    24444        0        0    41476    35899     5577
 Dalvik Other      700      700        0        0
        Stack      508      508        0        0
    Other dev    33564    32600        4        0
     .so mmap     9019     1244     7268        0
    .apk mmap      101        0       16        0
    .ttf mmap     1330        0      696        0
    .dex mmap     2248        0     2248        0
    code mmap      985        0      188        0
   image mmap     1182      908       12        0
   Other mmap      130        4      108        0
     Graphics    25504    25504        0        0
           GL     2196     2196        0        0
      Unknown    32476    32476        0        0
        TOTAL   322630   308456    10540        0   366708   209992    44171
實際的調用代碼入口在android.os.Debug.java和對應的CPP文件android_os_Debug.cpp,Debug.java的getMeminfo方法實際上調用了android_os_Debug.cpp的android_os_Debug_getDirtyPagesPid方法。
static void android_os_Debug_getDirtyPagesPid(JNIEnv *env, jobject clazz,
        jint pid, jobject object)
{
    stats_t stats[_NUM_HEAP];
    memset(&stats, 0, sizeof(stats));

    load_maps(pid, stats);

    struct graphics_memory_pss graphics_mem;
    if (read_memtrack_memory(pid, &graphics_mem) == 0) {
        ...
    }

    ...
}

static void load_maps(int pid, stats_t* stats)
{
    char tmp[128];
    FILE *fp;

    sprintf(tmp, "/proc/%d/smaps", pid);
    fp = fopen(tmp, "r");
    if (fp == 0) return;

    read_mapinfo(fp, stats);
    fclose(fp);
}
從上面的代碼可以看到,android_os_Debug_getDirtyPagesPid方法先調用了load_maps方法,而load_maps方法要做的事情也很簡單,它打開/proc/PID/smaps虛擬文件,讀取裡面的信息,在已ROOT的設備上,我們可以通過“adb shell cat /proce/PID/smaps”直接將這個虛擬文件的信息打印在控制台上。
80ff5000-810f2000 rw-p 00000000 00:00 0          [stack:12211]
Size:               1012 kB
Rss:                   4 kB
Pss:                   4 kB
...
81100000-811a4000 rw-s 000f4000 00:0b 6285       /dev/kgsl-3d0
Size:                656 kB
Rss:                 652 kB
Pss:                 352 kB
...
811d1000-811e0000 rw-p 00000000 00:00 0          [anon:libc_malloc]
Size:                 60 kB
Rss:                  60 kB
Pss:                  60 kB
...
Name:           [anon:libc_malloc]
“adb shell cat /proce/PID/smaps”輸出的信息如上圖所示,它實際上是應用的userspace地址空間的內存分配表,記錄了應用分配的每一塊內存的地址,類別,大小等信息,而load_maps方法調用read_mapinfo方法從這個表裡面讀出每一塊內存的分配信息,分類進行累加,得出Native Heap,Dalvik Heap等各個類別的內存占用。
但是應用所使用的全部內存裡面,有一些內存塊是不映射到進程的userspace地址空間的(主要是GPU所使用的內存),這些內存塊的信息在smaps裡面無法找到,所以在Android 4.4裡面新增了一個memtrack的HAL模塊由SoC廠商實現,如果SoC廠商實現了memtrack模塊,meminfo則可以通過libmemtrack的調用獲取一些跟GPU相關的內存使用信息。所以我們看到android_os_Debug_getDirtyPagesPid方法通過調用read_memtrack_memory方法來讀取Graphics,GL這兩項的內存使用信息。
/*
 * Uses libmemtrack to retrieve graphics memory that the process is using.
 * Any graphics memory reported in /proc/pid/smaps is not included here.
 */
static int read_memtrack_memory(struct memtrack_proc* p, int pid,
        struct graphics_memory_pss* graphics_mem)
{
    int err = memtrack_proc_get(p, pid);
    ...

    ssize_t pss = memtrack_proc_graphics_pss(p);
    ...
    graphics_mem->graphics = pss / 1024;

    pss = memtrack_proc_gl_pss(p);
    ...
    graphics_mem->gl = pss / 1024;

    pss = memtrack_proc_other_pss(p);
    ...
    graphics_mem->other = pss / 1024;

    return 0;
}
read_memtrack_memory方法的實現如上圖所示,它讀取了Graphics,GL,Other這三類內存信息,而這三個類別的定義在hardware/memtrack.h裡面。
/*
 * The Memory Tracker HAL is designed to return information about device-specific
 * memory usage.  The primary goal is to be able to track memory that is not
 * trackable in any other way, for example texture memory that is allocated by
 * a process, but not mapped in to that process' address space.
 * A secondary goal is to be able to categorize memory used by a process into
 * GL, graphics, etc.  All memory sizes should be in real memory usage,
 * accounting for stride, bit depth, rounding up to page size, etc.
 *
 * A process collecting memory statistics will call getMemory for each
 * combination of pid and memory type.  For each memory type that it recognizes
 * the HAL should fill out an array of memtrack_record structures breaking
 * down the statistics of that memory type as much as possible.  For example,
 * getMemory(, MEMTRACK_TYPE_GL) might return:
 * { { 4096,  ACCOUNTED | PRIVATE | SYSTEM },
 *   { 40960, UNACCOUNTED | PRIVATE | SYSTEM },
 *   { 8192,  ACCOUNTED | PRIVATE | DEDICATED },
 *   { 8192,  UNACCOUNTED | PRIVATE | DEDICATED } }
 * If the HAL could not differentiate between SYSTEM and DEDICATED memory, it
 * could return:
 * { { 12288,  ACCOUNTED | PRIVATE },
 *   { 49152,  UNACCOUNTED | PRIVATE } }
 *
 * Memory should not overlap between types.  For example, a graphics buffer
 * that has been mapped into the GPU as a surface should show up when
 * MEMTRACK_TYPE_GRAPHICS is requested, and not when MEMTRACK_TYPE_GL
 * is requested.
 */

enum memtrack_type {
    MEMTRACK_TYPE_OTHER = 0,
    MEMTRACK_TYPE_GL = 1,
    MEMTRACK_TYPE_GRAPHICS = 2,
    MEMTRACK_TYPE_MULTIMEDIA = 3,
    MEMTRACK_TYPE_CAMERA = 4,
    MEMTRACK_NUM_TYPES,
};
Graphics對應了MEMTRACK_TYPE_GRAPHICS,GL對應了MEMTRACK_TYPE_GL,而Other實際上是MEMTRACK_TYPE_OTHER,MEMTRACK_TYPE_MULTIMEDIA,MEMTRACK_TYPE_CAMERA這三項之和。memtrack是由SoC廠商實現的,在AOSP的源碼裡面我們可以找到高通的實現源碼,在msm8974/libmemtrack/kgsl.c裡面。
int kgsl_memtrack_get_memory(pid_t pid, enum memtrack_type type,
                             struct memtrack_record *records,
                             size_t *num_records)
{
    ...

    sprintf(tmp, "/d/kgsl/proc/%d/mem", pid);
    fp = fopen(tmp, "r");
    ...

    if (type == MEMTRACK_TYPE_GL) {
        sprintf(tmp, "/proc/%d/smaps", pid);
        smaps_fp = fopen(tmp, "r");
        ...
    }

    while (1) {
        unsigned long uaddr;
        unsigned long size;
        char line_type[7];
        int ret;

        if (fgets(line, sizeof(line), fp) == NULL) {
            break;
        }

        /* Format:
         *  gpuaddr useraddr     size    id flags       type            usage sglen
         * 545ba000 545ba000     4096     1 ----p     gpumem      arraybuffer     1
         */
        ret = sscanf(line, "%*x %lx %lu %*d %*s %6s %*s %*d\n",
                     &uaddr, &size, line_type);
        if (ret != 3) {
            continue;
        }

        if (type == MEMTRACK_TYPE_GL && strcmp(line_type, "gpumem") == 0) {
            bool accounted = false;
            /*
             * We need to cross reference the user address against smaps,
             *  luckily both are sorted.
             */
            while (smaps_addr <= uaddr) {
                unsigned long start;
                unsigned long end;
                unsigned long smaps_size;

                if (fgets(line, sizeof(line), smaps_fp) == NULL) {
                    break;
                }

                if (sscanf(line, "%8lx-%8lx", &start, &end) == 2) {
                    smaps_addr = start;
                    continue;
                }

                if (smaps_addr != uaddr) {
                    continue;
                }

                if (sscanf(line, "Rss: %lu kB", &smaps_size) == 1) {
                    if (smaps_size) {
                        accounted = true;
                        accounted_size += size;
                        break;
                    }
                }
            }
            if (!accounted) {
                unaccounted_size += size;
            }
        } else if (type == MEMTRACK_TYPE_GRAPHICS && strcmp(line_type, "ion") == 0) {
            unaccounted_size += size;
        }
    }

    ...
}
kgsl_memtrack_get_memory是memtrack的getMemory方法的具體實現,我們可以看到它實際上是讀取一張內部的GPU內存分配表的信息(虛擬文件/d/kgsl/proc/PID/mem),在已ROOT的設備上,我們可以通過“adb shell cat /d/kgsl/proc/PID/mem”將這張內存分配表的信息打印到控制台上,如下圖所示:
 gpuaddr useraddr     size    id flags       type            usage sglen
7565e000 00000000     4096     1 ----p     gpumem      arraybuffer     1
756bc000 00000000    65536     2 -r--p     gpumem          command    16
756cd000 00000000    65536     3 -r--p     gpumem          command    16
756de000 00000000    65536     4 -r--p     gpumem          command    16
756fb000 00000000     4096     5 ----p     gpumem               gl     1
75fe2000 00000000   262144     6 ----p     gpumem               gl    64
76023000 00000000     8192     7 ----p     gpumem               gl     2
76026000 00000000     8192     8 ----p     gpumem               gl     2
76029000 00000000     4096     9 ----p     gpumem          texture     1
...
94d71000 00000000   131072   362 ----p     gpumem  vertexarraybuff    32
94da0000 00000000   667648   176 --l-p     gpumem          texture   163
94e44000 00000000   131072   363 ----p     gpumem           any(0)    32
94e65000 00000000   131072   364 ----p     gpumem           any(0)    32
c0000000 00000000 17268736    31 --L--        ion        egl_image  4216
c1100000 00000000  8257536    36 --L--        ion      egl_surface    21
c1900000 00000000  8257536   164 --L--        ion      egl_surface    21
c2100000 00000000  8257536   175 --L--        ion      egl_surface    21
其中ion類型(由ION內存分配器分配的內存)的內存塊統計到Graphics類別裡面,從上圖我們可以看到有三塊egl_surface,它們對應應用所使用的窗口的三個Buffer,還有一個egl_image暫時不清楚用途(這塊17M的egl_image,在不同進程裡面的地址和ID號都是一樣的,所以猜測實際是Android在不同應用之間分享的Assert Atlas,Android 4.4開始,把系統的圖片資源拼接成一大塊紋理,然後通過GraphicBuffer + EGLImage在不同的應用之間共享),這些都是應用啟動後Android自動分配的。gpumem類型的內存塊統計到GL類別裡面,包括GL裡面的紋理(texture),各種shader,vertex buffer等等。另外,因為有些內存塊映射到了userspace,有些則沒有映射,所以映射到userspace的內存塊會被標記為accounted,避免meminfo重復計數,meminfo最終顯示的Graphics和GL的內存值是哪些沒有映射到userspace的內存塊的大小之和。
 android 5.X Toolbar+DrawerLayout實現抽屜菜單
前言?android5.X新增的一個控件Toolbar,這個控件比ActionBar更加自由,可控,由於以前的ActionBar的靈活性比較差,所以google逐漸使用T
 Android性能優化-SQLite數據庫
本系列博文我想圍繞在Android中的一些優化細節和大家進行分享。Android中的優化可謂又是一重任,Android不足以像PC端具有很高的內存執行空間給我們用來重量級
 Android基礎之Activity生命周期
子曰:溫故而知新,可以為師矣。《論語》學習技術也一樣,對於技術文檔或者經典的技術書籍來說,指望看一遍就完全掌握,那基本不大可能,所以我們需要經常回過頭再仔細研讀幾遍,以領
 Android四大組件之Service服務學習筆記(一)
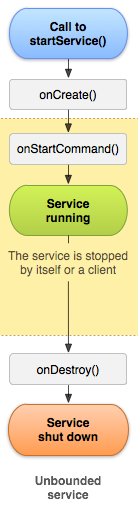
Service是安卓四大組件之一,服務是用在後台處理事情的,並且是不可見的,該服務不是我們所說的服務器的服務,他經常用來處理一些循環操作,但是它不同於子線程,服務是運行在
 [FastDev4Android框架開發]神器ViewGragHelper完全解析,媽媽再也不擔心我自定義ViewGroup滑動View操作啦~(三十三)
(一).前言:這幾天正在更新錄制實戰項目,整體框架是采用仿照