編輯:關於Android編程
Android開發者選項中提供了Profile GPU Rendering功能,用於在屏幕上實時顯示GPU渲染每一幀圖像花費的時間(單位:ms)。
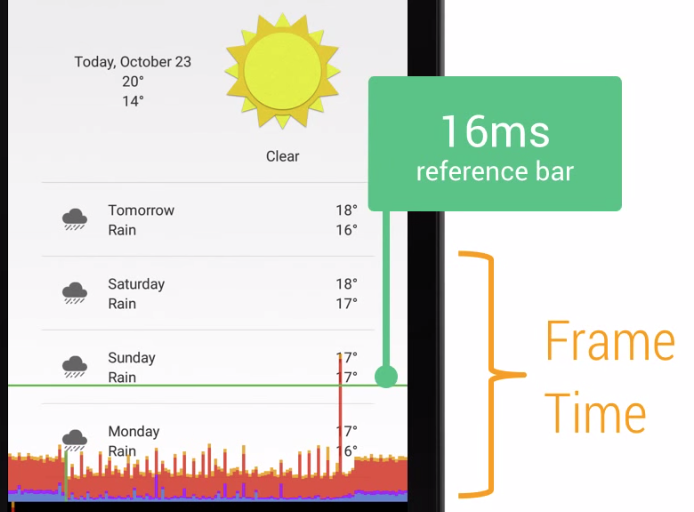
渲染時間用柱狀圖表示,上面的綠線代表16ms,也就是要盡量保證所有柱狀圖都在這條線下方。每一條柱狀圖都由3部分組成,藍色、紅色和黃色,代表渲染的3個不同的階段,通過分析這三個階段的時間就可以找到渲染時的性能瓶頸。
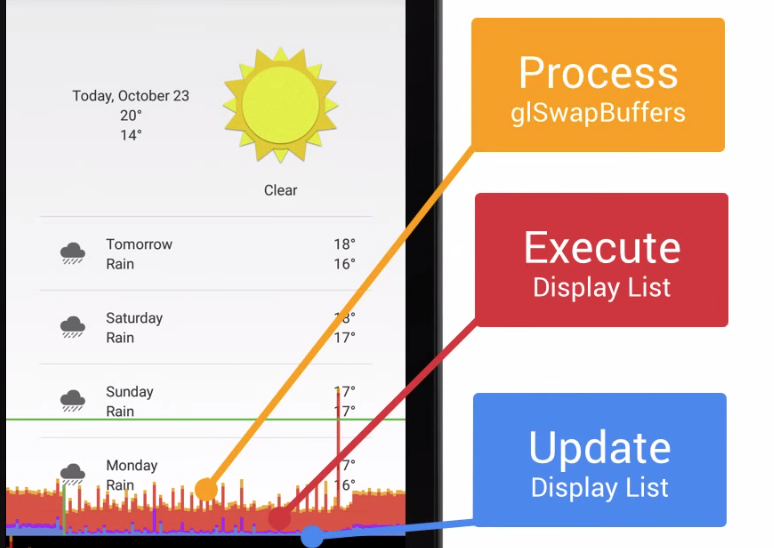
藍色部分表示繪制時間或者在Java層創建和更新display list的時間。在一個View 實際被渲染前,它需要先轉換為GPU能識別的格式。簡單來說可能就是幾個繪制命令,復雜一點,我們可能在嵌入了一條從canvas獲取的自定義路徑。這一步完成之後,輸出結果就會被系統作為display list緩存起來。
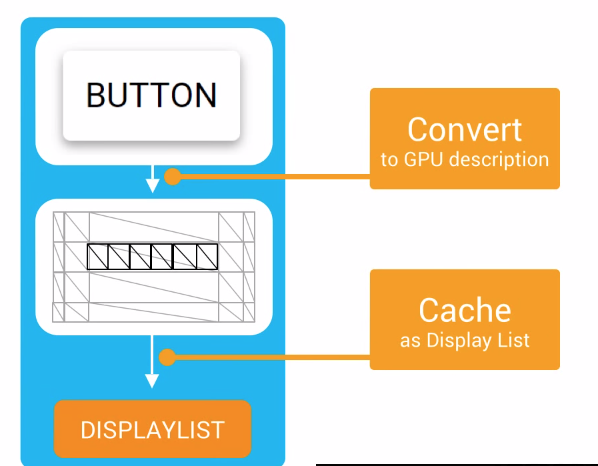

藍色部分記錄了這一幀對所有需要更新的view完成這兩步花費的時間。當它很高的時候,說明有很多view突然無效(invalidate)了,或者是有幾個自定義view在onDraw函數中做了特別復雜的繪制邏輯。
The blue section of that bar represents draw time or rather how long it took to create and update your display lists in Java. Remember that before a view can actually be rendered, it has to first be transformed into a GPU-friendly format.
On the simple side of this, it could just be a few Draw commands. But on the complex end, we could be tessellating a custom path coming from your canvas object.
Once done ,the results are then cached as a display list object by the system.
This blue bar is recording how much time it takes to complete these two steps for all the views that need to be updated on the screen this frame.
When you see this bar shoot high, it could mean that a bunch of views suddenly became invalidated, or it may be a few custom views who might have some extremely complex logic in their onDraw funtion.
紅色部分代表執行時間,也就是Android 2D渲染引擎(OpenGL)執行display list的時間。為了將變化繪制在屏幕上,Android需要使用OpenGL ES API來繪制這些display list信息,OpenGL最終將數據傳給了GPU,然後GPU渲染到屏幕上。View越復雜,OpenGL繪制所需要的命令也越復雜。如果紅色這一段比較高,復雜的view都可能是罪魁禍首。還有值得注意的是比較大的峰值,這說明有些view重復提交了,也就是繪制了多次,而它們可能並不需要重繪。
The red section of the bar represents execute time.This is the time spent by Android’s 2D renderer to execute display list.
See, in order to draw to the screen, Android needs to draw your display list information by interacting with the OpenGL ES API which effectively passes along data to the GPU, which then, ultimately, ends up putting pixels on the screen. Remember that for more complex views like a custom view, the more complex the commands needed for OpenGL to draw it.
And when you see this red bar shoot high, these complex views are a likely culprit.
It’s also worth noting that large spikes in this bar can come from re-submitting a load of views to be redrawn again. These views haven’t necessarily been invalidated. But if something happens, like a view rotates, then we need to go back and clean up areas of the screen that might be affected by that redrawing the views underneath it.
橙色部分代表處理時間,更進一步,就是CPU告訴GPU渲染已經完成的時間。這部分是阻塞的,CPU會等待GPU知道確認收到了命令,如果這裡比較高,說明GPU做的任務太多了,通常是由於很多復雜的view繪制從而需要過多的OpenGL渲染命令去處理。
The oragen section of the bar represents the process time. Or rather, this is where the CPU tells the GPU that it’s done rendering a frame. This action is a blocking call, and as such the CPU will sit around and wait for the GPU to acknowledge that it’s received the command. If this bar is getting large, then it means that you’re doing a lot of work on the GPU resulting from many complex views that require a lot of OpenGL rendering commands to be processed.
CPU 與 GPU
現代的圖形API不允許CPU直接與GPU通信,而是通過中間的一個圖形驅動層(Graphics Driver)來連接這兩部分。
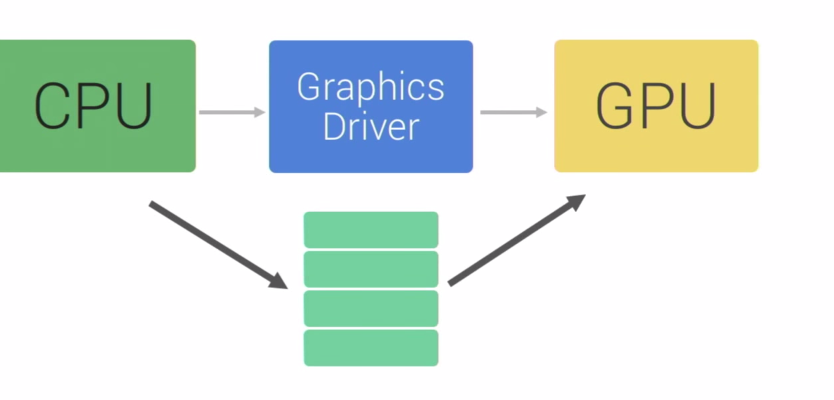
圖形驅動維護了一個隊列,CPU把display list添加到隊列裡,GPU從這個隊列取出數據進行繪制。
Android Performance Patterns: Tool - Profile GPU Rendering
Perf Primer : CPU, GPU and your Android game
 Android開發之多級下拉列表菜單實現(仿美團,淘寶等)
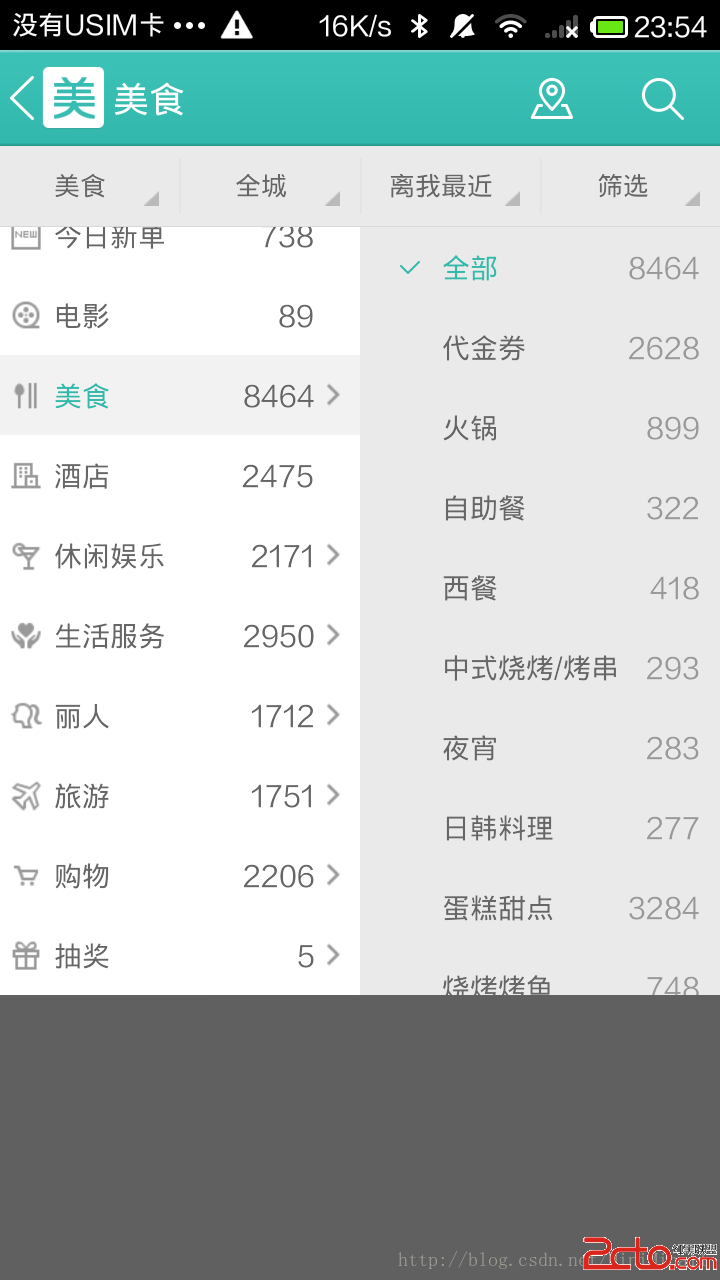
我們在常用的電商或者旅游APP中,例如美團,手機淘寶等等,都能夠看的到有那種下拉式的二級列表菜單。具體如圖所示: 上面兩張圖就是美團的一個二級列表菜單的一個展
 Action獲取請求參數的三種方式
方式一:Action本身作為Model對象,通過屬性注入(Setter)方法講參數數據封裝到Action中 具體為:在Action中,提供和參數名相同的幾個屬性,並
 Android開發本地及網絡Mp3音樂播放器(十八)新下載歌曲加載准備SdcardSearchToList
掃描本地文件加載到item不限於應用到音樂播放器,其他Android工程,也可以使用SdcardSearchToList其他Android工程也可以使用,我現在做了很小的
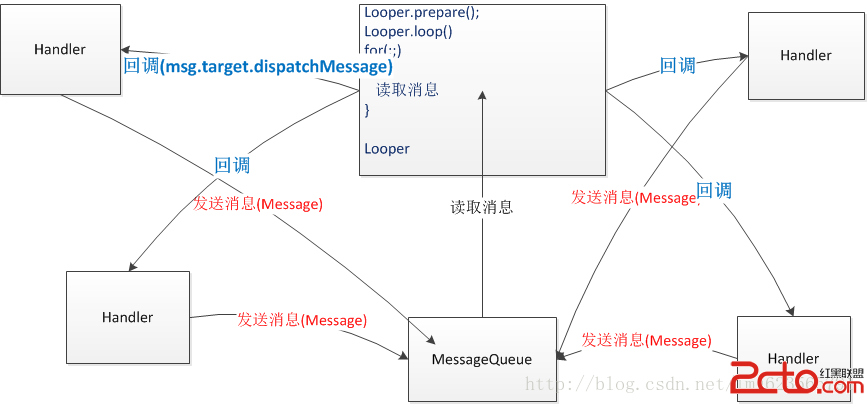 Android 異步消息處理機制 讓你深入理解 Looper、Handler、Message三者關系
轉載請標明出處:http://blog.csdn.net/lmj623565791/article/details/38377229 ,本文出自【張鴻洋的博客】很多人面試