編輯:關於Android編程
Android系統想要成為一個功能完備,生態繁榮的操作系統,那就必須提供完整的應用開發環境。而在應用開發中,app程序的調試分析是日常生產中進程會進行的工作。Android為了方便開發人員分析整個系統平台和某個app在運行一段時間之內的所有信息,專門開發了bugreport工具。這個工具使用起來十分簡單,只要在終端執行(linux或者win):
adb bugreport > bugreport.txt
即可生成bugreport文件。但是有一個問題是,這個生成的文件有的時候異常龐大,能夠達到15M+,想一想對於一個txt文本格式的文件內容長度達到了15M+是一個什麼概念,如果使用文本工具打開查看將是一個噩夢。因此google針對android 5.0(api 21)以上的系統開發了一個叫做battery historian的分析工具,這個工具就是用來解析這個txt文本文件,然後使用web圖形的形式展現出來,這樣出來的效果更加人性化,更加可讀。它的基本界面像下面這個樣子:


目前google已經將bettery histZ喎?/kf/ware/vc/" target="_blank" class="keylink">vcmlhbr+q1LTBy6Osv6rUtM/uxL+1xLXY1rejujxiciAvPg0KPGEgaHJlZj0="https://github.com/google/battery-historian">https://github.com/google/battery-historian

google寫了一個比較詳細的說明文檔,大家可以自行查閱一下。這個工具可以查看以下信息:
Brightness
CPU running
Charging on
Charging status
Health
JobScheduler
Kernel only uptime
Level
Package active
Partial wakelock
Phone scanning
Phone state
Plug
Plugged
Screen
Temperature
Top app
Voltage
Wifi on
Wifi running
Wifi supplicant
數據還是比較詳細的。

當然,同樣的bugreport數據也可以有不同的解析和閱讀方式,你如果不太喜歡google的battery historian的話,你還有別的選擇,那就是選擇Sony開源的ChkBugReport,這個工具提供了不同於battery historian的視角去解讀bugreport文件,見面簡單明了:


這個項目的文檔:

http://developer.sonymobile.com/2012/01/25/new-bugreport-analysis-tool-released-as-open-source/

開源地址首頁:

https://github.com/sonyxperiadev/ChkBugReport

這裡說明一下,筆者使用過ChkBugReport這個工具,感覺很不錯,最好結合google的battery historian;另外ChkBugReport這個工具還有一點bug,不過不影響使用。
bugreport的原理是什麼?下面我們簡要分析一下adb bugreport運行的原理。我們知道,使用bugreport只要執行adb bugreport命令就可以了,因此我們的分析肯定是從adbd這個daemon進程開始,我們查看這個進程的代碼的時候發現這裡處理了bugreport選項:
adb_commandline@system/core/adb/commandline.cpp

我們可以清楚地看到,這裡判斷如果附帶的參數是bugreport的話,那就直接調用send_shell_command函數處理,這個函數的代碼比較簡單,我們就不分析了,這個函數的功能就是使用shell執行參數中的命令,因此我們這裡相當於執行了bugreport命令。
在android設備中,bugreport命令存在於system/bin/目錄下,這是一個可執行文件,所以我們要查看這個可執行文件實現的地方,它的實現代碼在/frameworks/native/cmds/bugreport/目錄下:

我們看到,bugreport的實現是比較簡單的,只有一個Android.mk和一個cpp實現代碼,我們先看一下Android.mk文件:

這裡我們看到該目錄下的代碼會被編譯成一個名字叫做bugreport的可執行文件,這就是我們想要找的。現在我們看一下bugreport.cpp文件的實現,這個文件中代碼比較簡單,只有一個main函數:
// This program will trigger the dumpstate service to start a call to
// dumpstate, then connect to the dumpstate local client to read the
// output. All of the dumpstate output is written to stdout, including
// any errors encountered while reading/writing the output.
int main() {
  // Start the dumpstate service.
  property_set("ctl.start", "dumpstate");

  // Socket will not be available until service starts.
  int s;
  for (int i = 0; i < 20; i++) {
    s = socket_local_client("dumpstate", ANDROID_SOCKET_NAMESPACE_RESERVED,
                            SOCK_STREAM);
    if (s >= 0)
      break;
    // Try again in 1 second.
    sleep(1);
  }

  if (s == -1) {
    printf("Failed to connect to dumpstate service: %s\n", strerror(errno));
    return 1;
  }

  // Set a timeout so that if nothing is read in 3 minutes, we'll stop
  // reading and quit. No timeout in dumpstate is longer than 60 seconds,
  // so this gives lots of leeway in case of unforeseen time outs.
  struct timeval tv;
  tv.tv_sec = 3 * 60;
  tv.tv_usec = 0;
  if (setsockopt(s, SOL_SOCKET, SO_RCVTIMEO, &tv, sizeof(tv)) == -1) {
    printf("WARNING: Cannot set socket timeout: %s\n", strerror(errno));
  }

  while (1) {
    char buffer[65536];
    ssize_t bytes_read = TEMP_FAILURE_RETRY(read(s, buffer, sizeof(buffer)));
    if (bytes_read == 0) {
      break;
    } else if (bytes_read == -1) {
      // EAGAIN really means time out, so change the errno.
      if (errno == EAGAIN) {
        errno = ETIMEDOUT;
      }
      printf("\nBugreport read terminated abnormally (%s).\n", strerror(errno));
      break;
    }

    ssize_t bytes_to_send = bytes_read;
    ssize_t bytes_written;
    do {
      bytes_written = TEMP_FAILURE_RETRY(write(STDOUT_FILENO,
                                               buffer + bytes_read - bytes_to_send,
                                               bytes_to_send));
      if (bytes_written == -1) {
        printf("Failed to write data to stdout: read %zd, trying to send %zd (%s)\n",
               bytes_read, bytes_to_send, strerror(errno));
        return 1;
      }
      bytes_to_send -= bytes_written;
    } while (bytes_written != 0 && bytes_to_send > 0);
  }

  close(s);
  return 0;
}
這裡的代碼非常簡單,主要的邏輯就是:

1.啟動dumpstate service

2. 和dumpstate service建立socket鏈接

3. 從socket中讀取數據,並且答應到stdout中

4. 讀取完成之後關閉socket,然後退出

因此,我們分析的重點需要轉移到dumpstate中了。這裡說明一下,前面啟動dumpstate service的方法是使用系統屬性來實現,這個屬性的改變消息會被init進程收到,然後init進程會啟動dumpstate這個服務。

dumpstate其實也是一個可執行文件,也存在於system/bin目錄下。現在我們明白了,其實bugreport就是dumpstate,只是bugreport將dumpstate包裝了一下而已。

現在我們需要分析一下dumpstate的實現,它的實現代碼在:frameworks/native/cmds/dumpstate目錄下,我們看下這個目錄下的代碼結構:


這裡的代碼也是十分簡單,只要少數的幾個實現文件,其中main函數在dumpstate.c文件中,這個main函數我們這裡不詳細分析了,總結下它的主要工作:

1. 根據啟動參數,初始化相關資源

2. 如果啟動參數中帶有-s的話(init啟動會加上這個參數),就表示使用socket,那麼就啟動socket,並且在這個socket中等待鏈接。

3. 如果client端(也就是bugreport進程)鏈接成功,那就初始化所要用到的內存,並且設置優先級為較高優先級,防止被OOM干掉。

4. 然後使用vibrator震動一下(如果設備有這個硬件的話),提示用戶開始截取log了

5. 調用dumpstate函數開始真正的dump工作

6. dump完成之後再次調用vibrator震動3次,提示用戶dump完成。

現在我們看下dumpstate函數的實現:
/* dumps the current system state to stdout */
static void dumpstate() {
    unsigned long timeout;
    time_t now = time(NULL);
    char build[PROPERTY_VALUE_MAX], fingerprint[PROPERTY_VALUE_MAX];
    char radio[PROPERTY_VALUE_MAX], bootloader[PROPERTY_VALUE_MAX];
    char network[PROPERTY_VALUE_MAX], date[80];
    char build_type[PROPERTY_VALUE_MAX];

    property_get("ro.build.display.id", build, "(unknown)");
    property_get("ro.build.fingerprint", fingerprint, "(unknown)");
    property_get("ro.build.type", build_type, "(unknown)");
    property_get("ro.baseband", radio, "(unknown)");
    property_get("ro.bootloader", bootloader, "(unknown)");
    property_get("gsm.operator.alpha", network, "(unknown)");
    strftime(date, sizeof(date), "%Y-%m-%d %H:%M:%S", localtime(&now));

    printf("========================================================\n");
    printf("== dumpstate: %s\n", date);
    printf("========================================================\n");

    printf("\n");
    printf("Build: %s\n", build);
    printf("Build fingerprint: '%s'\n", fingerprint); /* format is important for other tools */
    printf("Bootloader: %s\n", bootloader);
    printf("Radio: %s\n", radio);
    printf("Network: %s\n", network);

    printf("Kernel: ");
    dump_file(NULL, "/proc/version");
    printf("Command line: %s\n", strtok(cmdline_buf, "\n"));
    printf("\n");

    dump_dev_files("TRUSTY VERSION", "/sys/bus/platform/drivers/trusty", "trusty_version");
    run_command("UPTIME", 10, "uptime", NULL);
    dump_files("UPTIME MMC PERF", mmcblk0, skip_not_stat, dump_stat_from_fd);
    dump_file("MEMORY INFO", "/proc/meminfo");
    run_command("CPU INFO", 10, "top", "-n", "1", "-d", "1", "-m", "30", "-t", NULL);
    run_command("PROCRANK", 20, "procrank", NULL);
    dump_file("VIRTUAL MEMORY STATS", "/proc/vmstat");
    dump_file("VMALLOC INFO", "/proc/vmallocinfo");
    dump_file("SLAB INFO", "/proc/slabinfo");
    dump_file("ZONEINFO", "/proc/zoneinfo");
    dump_file("PAGETYPEINFO", "/proc/pagetypeinfo");
    dump_file("BUDDYINFO", "/proc/buddyinfo");
    dump_file("FRAGMENTATION INFO", "/d/extfrag/unusable_index");

    dump_file("KERNEL WAKELOCKS", "/proc/wakelocks");
    dump_file("KERNEL WAKE SOURCES", "/d/wakeup_sources");
    dump_file("KERNEL CPUFREQ", "/sys/devices/system/cpu/cpu0/cpufreq/stats/time_in_state");
    dump_file("KERNEL SYNC", "/d/sync");

    run_command("PROCESSES", 10, "ps", "-P", NULL);
    run_command("PROCESSES AND THREADS", 10, "ps", "-t", "-p", "-P", NULL);
    run_command("PROCESSES (SELINUX LABELS)", 10, "ps", "-Z", NULL);
    run_command("LIBRANK", 10, "librank", NULL);

    do_dmesg();

    run_command("LIST OF OPEN FILES", 10, SU_PATH, "root", "lsof", NULL);
    for_each_pid(do_showmap, "SMAPS OF ALL PROCESSES");
    for_each_tid(show_wchan, "BLOCKED PROCESS WAIT-CHANNELS");

    if (screenshot_path[0]) {
        ALOGI("taking screenshot\n");
        run_command(NULL, 10, "/system/bin/screencap", "-p", screenshot_path, NULL);
        ALOGI("wrote screenshot: %s\n", screenshot_path);
    }

    // dump_file("EVENT LOG TAGS", "/etc/event-log-tags");
    // calculate timeout
    timeout = logcat_timeout("main") + logcat_timeout("system") + logcat_timeout("crash");
    if (timeout < 20000) {
        timeout = 20000;
    }
    run_command("SYSTEM LOG", timeout / 1000, "logcat", "-v", "threadtime", "-d", "*:v", NULL);
    timeout = logcat_timeout("events");
    if (timeout < 20000) {
        timeout = 20000;
    }
    run_command("EVENT LOG", timeout / 1000, "logcat", "-b", "events", "-v", "threadtime", "-d", "*:v", NULL);
    timeout = logcat_timeout("radio");
    if (timeout < 20000) {
        timeout = 20000;
    }
    run_command("RADIO LOG", timeout / 1000, "logcat", "-b", "radio", "-v", "threadtime", "-d", "*:v", NULL);

    run_command("LOG STATISTICS", 10, "logcat", "-b", "all", "-S", NULL);

    /* show the traces we collected in main(), if that was done */
    if (dump_traces_path != NULL) {
        dump_file("VM TRACES JUST NOW", dump_traces_path);
    }

    /* only show ANR traces if they're less than 15 minutes old */
    struct stat st;
    char anr_traces_path[PATH_MAX];
    property_get("dalvik.vm.stack-trace-file", anr_traces_path, "");
    if (!anr_traces_path[0]) {
        printf("*** NO VM TRACES FILE DEFINED (dalvik.vm.stack-trace-file)\n\n");
    } else {
      int fd = TEMP_FAILURE_RETRY(open(anr_traces_path,
                                       O_RDONLY | O_CLOEXEC | O_NOFOLLOW | O_NONBLOCK));
      if (fd < 0) {
          printf("*** NO ANR VM TRACES FILE (%s): %s\n\n", anr_traces_path, strerror(errno));
      } else {
          dump_file_from_fd("VM TRACES AT LAST ANR", anr_traces_path, fd);
      }
    }

    /* slow traces for slow operations */
    if (anr_traces_path[0] != 0) {
        int tail = strlen(anr_traces_path)-1;
        while (tail > 0 && anr_traces_path[tail] != '/') {
            tail--;
        }
        int i = 0;
        while (1) {
            sprintf(anr_traces_path+tail+1, "slow%02d.txt", i);
            if (stat(anr_traces_path, &st)) {
                // No traces file at this index, done with the files.
                break;
            }
            dump_file("VM TRACES WHEN SLOW", anr_traces_path);
            i++;
        }
    }

    int dumped = 0;
    for (size_t i = 0; i < NUM_TOMBSTONES; i++) {
        if (tombstone_data[i].fd != -1) {
            dumped = 1;
            dump_file_from_fd("TOMBSTONE", tombstone_data[i].name, tombstone_data[i].fd);
            tombstone_data[i].fd = -1;
        }
    }
    if (!dumped) {
        printf("*** NO TOMBSTONES to dump in %s\n\n", TOMBSTONE_DIR);
    }

    dump_file("NETWORK DEV INFO", "/proc/net/dev");
    dump_file("QTAGUID NETWORK INTERFACES INFO", "/proc/net/xt_qtaguid/iface_stat_all");
    dump_file("QTAGUID NETWORK INTERFACES INFO (xt)", "/proc/net/xt_qtaguid/iface_stat_fmt");
    dump_file("QTAGUID CTRL INFO", "/proc/net/xt_qtaguid/ctrl");
    dump_file("QTAGUID STATS INFO", "/proc/net/xt_qtaguid/stats");

    if (!stat(PSTORE_LAST_KMSG, &st)) {
        /* Also TODO: Make console-ramoops CAP_SYSLOG protected. */
        dump_file("LAST KMSG", PSTORE_LAST_KMSG);
    } else {
        /* TODO: Make last_kmsg CAP_SYSLOG protected. b/5555691 */
        dump_file("LAST KMSG", "/proc/last_kmsg");
    }

    /* kernels must set CONFIG_PSTORE_PMSG, slice up pstore with device tree */
    run_command("LAST LOGCAT", 10, "logcat", "-L", "-v", "threadtime",
                                             "-b", "all", "-d", "*:v", NULL);

    /* The following have a tendency to get wedged when wifi drivers/fw goes belly-up. */

    run_command("NETWORK INTERFACES", 10, "ip", "link", NULL);

    run_command("IPv4 ADDRESSES", 10, "ip", "-4", "addr", "show", NULL);
    run_command("IPv6 ADDRESSES", 10, "ip", "-6", "addr", "show", NULL);

    run_command("IP RULES", 10, "ip", "rule", "show", NULL);
    run_command("IP RULES v6", 10, "ip", "-6", "rule", "show", NULL);

    dump_route_tables();

    run_command("ARP CACHE", 10, "ip", "-4", "neigh", "show", NULL);
    run_command("IPv6 ND CACHE", 10, "ip", "-6", "neigh", "show", NULL);

    run_command("IPTABLES", 10, SU_PATH, "root", "iptables", "-L", "-nvx", NULL);
    run_command("IP6TABLES", 10, SU_PATH, "root", "ip6tables", "-L", "-nvx", NULL);
    run_command("IPTABLE NAT", 10, SU_PATH, "root", "iptables", "-t", "nat", "-L", "-nvx", NULL);
    /* no ip6 nat */
    run_command("IPTABLE RAW", 10, SU_PATH, "root", "iptables", "-t", "raw", "-L", "-nvx", NULL);
    run_command("IP6TABLE RAW", 10, SU_PATH, "root", "ip6tables", "-t", "raw", "-L", "-nvx", NULL);

    run_command("WIFI NETWORKS", 20,
            SU_PATH, "root", "wpa_cli", "IFNAME=wlan0", "list_networks", NULL);

#ifdef FWDUMP_bcmdhd
    run_command("ND OFFLOAD TABLE", 5,
            SU_PATH, "root", "wlutil", "nd_hostip", NULL);

    run_command("DUMP WIFI INTERNAL COUNTERS (1)", 20,
            SU_PATH, "root", "wlutil", "counters", NULL);

    run_command("ND OFFLOAD STATUS (1)", 5,
            SU_PATH, "root", "wlutil", "nd_status", NULL);

#endif
    dump_file("INTERRUPTS (1)", "/proc/interrupts");

    run_command("NETWORK DIAGNOSTICS", 10, "dumpsys", "connectivity", "--diag", NULL);

#ifdef FWDUMP_bcmdhd
    run_command("DUMP WIFI STATUS", 20,
            SU_PATH, "root", "dhdutil", "-i", "wlan0", "dump", NULL);

    run_command("DUMP WIFI INTERNAL COUNTERS (2)", 20,
            SU_PATH, "root", "wlutil", "counters", NULL);

    run_command("ND OFFLOAD STATUS (2)", 5,
            SU_PATH, "root", "wlutil", "nd_status", NULL);
#endif
    dump_file("INTERRUPTS (2)", "/proc/interrupts");

    print_properties();

    run_command("VOLD DUMP", 10, "vdc", "dump", NULL);
    run_command("SECURE CONTAINERS", 10, "vdc", "asec", "list", NULL);

    run_command("FILESYSTEMS & FREE SPACE", 10, "df", NULL);

    run_command("LAST RADIO LOG", 10, "parse_radio_log", "/proc/last_radio_log", NULL);

    printf("------ BACKLIGHTS ------\n");
    printf("LCD brightness=");
    dump_file(NULL, "/sys/class/leds/lcd-backlight/brightness");
    printf("Button brightness=");
    dump_file(NULL, "/sys/class/leds/button-backlight/brightness");
    printf("Keyboard brightness=");
    dump_file(NULL, "/sys/class/leds/keyboard-backlight/brightness");
    printf("ALS mode=");
    dump_file(NULL, "/sys/class/leds/lcd-backlight/als");
    printf("LCD driver registers:\n");
    dump_file(NULL, "/sys/class/leds/lcd-backlight/registers");
    printf("\n");

    /* Binder state is expensive to look at as it uses a lot of memory. */
    dump_file("BINDER FAILED TRANSACTION LOG", "/sys/kernel/debug/binder/failed_transaction_log");
    dump_file("BINDER TRANSACTION LOG", "/sys/kernel/debug/binder/transaction_log");
    dump_file("BINDER TRANSACTIONS", "/sys/kernel/debug/binder/transactions");
    dump_file("BINDER STATS", "/sys/kernel/debug/binder/stats");
    dump_file("BINDER STATE", "/sys/kernel/debug/binder/state");

    printf("========================================================\n");
    printf("== Board\n");
    printf("========================================================\n");

    dumpstate_board();
    printf("\n");

    /* Migrate the ril_dumpstate to a dumpstate_board()? */
    char ril_dumpstate_timeout[PROPERTY_VALUE_MAX] = {0};
    property_get("ril.dumpstate.timeout", ril_dumpstate_timeout, "30");
    if (strnlen(ril_dumpstate_timeout, PROPERTY_VALUE_MAX - 1) > 0) {
        if (0 == strncmp(build_type, "user", PROPERTY_VALUE_MAX - 1)) {
            // su does not exist on user builds, so try running without it.
            // This way any implementations of vril-dump that do not require
            // root can run on user builds.
            run_command("DUMP VENDOR RIL LOGS", atoi(ril_dumpstate_timeout),
                    "vril-dump", NULL);
        } else {
            run_command("DUMP VENDOR RIL LOGS", atoi(ril_dumpstate_timeout),
                    SU_PATH, "root", "vril-dump", NULL);
        }
    }

    printf("========================================================\n");
    printf("== Android Framework Services\n");
    printf("========================================================\n");

    /* the full dumpsys is starting to take a long time, so we need
       to increase its timeout.  we really need to do the timeouts in
       dumpsys itself... */
    run_command("DUMPSYS", 60, "dumpsys", NULL);

    printf("========================================================\n");
    printf("== Checkins\n");
    printf("========================================================\n");

    run_command("CHECKIN BATTERYSTATS", 30, "dumpsys", "batterystats", "-c", NULL);
    run_command("CHECKIN MEMINFO", 30, "dumpsys", "meminfo", "--checkin", NULL);
    run_command("CHECKIN NETSTATS", 30, "dumpsys", "netstats", "--checkin", NULL);
    run_command("CHECKIN PROCSTATS", 30, "dumpsys", "procstats", "-c", NULL);
    run_command("CHECKIN USAGESTATS", 30, "dumpsys", "usagestats", "-c", NULL);
    run_command("CHECKIN PACKAGE", 30, "dumpsys", "package", "--checkin", NULL);

    printf("========================================================\n");
    printf("== Running Application Activities\n");
    printf("========================================================\n");

    run_command("APP ACTIVITIES", 30, "dumpsys", "activity", "all", NULL);

    printf("========================================================\n");
    printf("== Running Application Services\n");
    printf("========================================================\n");

    run_command("APP SERVICES", 30, "dumpsys", "activity", "service", "all", NULL);

    printf("========================================================\n");
    printf("== Running Application Providers\n");
    printf("========================================================\n");

    run_command("APP SERVICES", 30, "dumpsys", "activity", "provider", "all", NULL);


    printf("========================================================\n");
    printf("== dumpstate: done\n");
    printf("========================================================\n");
}
上面的代碼比較長,是因為所要dump的模塊太多,但是基本邏輯還是比較清楚的,我們看到基本的數據來源就是:

1.系統屬性

2./proc和/sys節點文件

3.執行shell命令獲得相關輸出

4.logcat輸出

5.Android Framework Services信息基本使用dumpsys命令通過binder調用服務中的dump函數獲得信息

這裡我們需要看一下dumpsys命令的實現,這個命令也是比較簡單,實現全部在main函數中:
int main(int argc, char* const argv[])
{
    signal(SIGPIPE, SIG_IGN);
    sp sm = defaultServiceManager();
    fflush(stdout);
    if (sm == NULL) {
        ALOGE("Unable to get default service manager!");
        aerr << "dumpsys: Unable to get default service manager!" << endl;
        return 20;
    }

    Vector services;
    Vector args;
    bool showListOnly = false;
    if ((argc == 2) && (strcmp(argv[1], "-l") == 0)) {
        showListOnly = true;
    }
    if ((argc == 1) || showListOnly) {
        services = sm->listServices();
        services.sort(sort_func);
        args.add(String16("-a"));
    } else {
        services.add(String16(argv[1]));
        for (int i=2; i 1) {
        // first print a list of the current services
        aout << "Currently running services:" << endl;

        for (size_t i=0; i service = sm->checkService(services[i]);
            if (service != NULL) {
                aout << "  " << services[i] << endl;
            }
        }
    }

    if (showListOnly) {
        return 0;
    }

    for (size_t i=0; i service = sm->checkService(services[i]);
        if (service != NULL) {
            if (N > 1) {
                aout << "------------------------------------------------------------"
                        "-------------------" << endl;
                aout << "DUMP OF SERVICE " << services[i] << ":" << endl;
            }
            int err = service->dump(STDOUT_FILENO, args);
            if (err != 0) {
                aerr << "Error dumping service info: (" << strerror(err)
                        << ") " << services[i] << endl;
            }
        } else {
            aerr << "Can't find service: " << services[i] << endl;
        }
    }

    return 0;
}
我們看到它的代碼邏輯就是,通過Binder的SM查找參數中的service,然後通過:
int err = service->dump(STDOUT_FILENO, args);
這句來調用service的dump函數。

dumpstate會調用到所有binder中的service的dump函數,因為dumpstate函數執行了這一句:
/* the full dumpsys is starting to take a long time, so we need
   to increase its timeout.  we really need to do the timeouts in
   dumpsys itself... */
run_command("DUMPSYS", 60, "dumpsys", NULL);
直接執行dumpsys,沒有參數,並且注釋中也說的很清楚,就是采集所有的信息。這會執行以下service的dump函數(執行dumpsys | grep “DUMP OF SERVICE”可以看到):
DUMP OF SERVICE DockObserver:
DUMP OF SERVICE SurfaceFlinger:
DUMP OF SERVICE accessibility:
DUMP OF SERVICE account:
DUMP OF SERVICE activity:
DUMP OF SERVICE alarm:
DUMP OF SERVICE android.security.keystore:
DUMP OF SERVICE android.service.gatekeeper.IGateKeeperService:
DUMP OF SERVICE appops:
DUMP OF SERVICE appwidget:
DUMP OF SERVICE assetatlas:
DUMP OF SERVICE audio:
DUMP OF SERVICE backup:
DUMP OF SERVICE battery:
DUMP OF SERVICE batteryproperties:
DUMP OF SERVICE batterystats:
DUMP OF SERVICE bluetooth_manager:
DUMP OF SERVICE carrier_config:
DUMP OF SERVICE clipboard:
DUMP OF SERVICE commontime_management:
DUMP OF SERVICE connectivity:
DUMP OF SERVICE consumer_ir:
DUMP OF SERVICE content:
DUMP OF SERVICE country_detector:
DUMP OF SERVICE cpuinfo:
DUMP OF SERVICE dbinfo:
DUMP OF SERVICE device_policy:
DUMP OF SERVICE deviceidle:
DUMP OF SERVICE devicestoragemonitor:
DUMP OF SERVICE diskstats:
DUMP OF SERVICE display:
DUMP OF SERVICE display.qservice:
DUMP OF SERVICE dreams:
DUMP OF SERVICE drm.drmManager:
DUMP OF SERVICE dropbox:
DUMP OF SERVICE ethernet:
DUMP OF SERVICE fingerprint:
DUMP OF SERVICE gfxinfo:
DUMP OF SERVICE graphicsstats:
DUMP OF SERVICE imms:
DUMP OF SERVICE input:
DUMP OF SERVICE input_method:
DUMP OF SERVICE iphonesubinfo:
DUMP OF SERVICE isms:
DUMP OF SERVICE isub:
DUMP OF SERVICE jobscheduler:
DUMP OF SERVICE launcherapps:
DUMP OF SERVICE location:
DUMP OF SERVICE lock_settings:
DUMP OF SERVICE media.audio_flinger:
DUMP OF SERVICE media.audio_policy:
DUMP OF SERVICE media.camera:
DUMP OF SERVICE media.camera.proxy:
DUMP OF SERVICE media.player:
DUMP OF SERVICE media.radio:
DUMP OF SERVICE media.resource_manager:
DUMP OF SERVICE media.sound_trigger_hw:
DUMP OF SERVICE media_projection:
DUMP OF SERVICE media_router:
DUMP OF SERVICE media_session:
DUMP OF SERVICE meminfo:
DUMP OF SERVICE midi:
DUMP OF SERVICE mount:
DUMP OF SERVICE netpolicy:
DUMP OF SERVICE netstats:
DUMP OF SERVICE network_management:
DUMP OF SERVICE network_score:
DUMP OF SERVICE nfc:
DUMP OF SERVICE notification:
DUMP OF SERVICE package:
DUMP OF SERVICE permission:
DUMP OF SERVICE persistent_data_block:
DUMP OF SERVICE phone:
DUMP OF SERVICE power:
DUMP OF SERVICE print:
DUMP OF SERVICE processinfo:
DUMP OF SERVICE procstats:
DUMP OF SERVICE restrictions:
DUMP OF SERVICE rttmanager:
DUMP OF SERVICE samplingprofiler:
DUMP OF SERVICE scheduling_policy:
DUMP OF SERVICE search:
DUMP OF SERVICE sensorservice:
DUMP OF SERVICE serial:
DUMP OF SERVICE servicediscovery:
DUMP OF SERVICE simphonebook:
DUMP OF SERVICE sip:
DUMP OF SERVICE statusbar:
DUMP OF SERVICE telecom:
DUMP OF SERVICE telephony.registry:
DUMP OF SERVICE textservices:
DUMP OF SERVICE trust:
DUMP OF SERVICE uimode:
DUMP OF SERVICE updatelock:
DUMP OF SERVICE usagestats:
DUMP OF SERVICE usb:
DUMP OF SERVICE user:
DUMP OF SERVICE vibrator:
DUMP OF SERVICE voiceinteraction:
DUMP OF SERVICE wallpaper:
DUMP OF SERVICE webviewupdate:
DUMP OF SERVICE wifi:
DUMP OF SERVICE wifip2p:
DUMP OF SERVICE wifiscanner:
DUMP OF SERVICE window:
這裡總結以下,上面的bugreport整體邏輯如下圖描述(如果圖片太小看不清,請下載圖片並查看):

adb bugreport的其他選項bugreport本身並沒有什麼選項,主要是通過dumpsys等命令配合完成,詳見battery historian項目主頁:https://github.com/google/battery-historian,以下是個總結:
1). 重置電池統計信息:
adb shell dumpsys batterystats --reset
2). Wakelock analysis全部wakelock信息:
adb shell dumpsys batterystats --enable full-wake-history
3). Kernel trace analysis分析內核,主要分析wakeup source和wakelock activities,首先使能kernel分析:
$ adb root
$ adb shell

# Set the events to trace.
$ echo "power:wakeup_source_activate" >> /d/tracing/set_event
$ echo "power:wakeup_source_deactivate" >> /d/tracing/set_event

# The default trace size for most devices is 1MB, which is relatively low and might cause the logs to overflow.
# 8MB to 10MB should be a decent size for 5-6 hours of logging.

$ echo 8192 > /d/tracing/buffer_size_kb

$ echo 1 > /d/tracing/tracing_on
然後獲得log:
$ echo 0 > /d/tracing/tracing_on
$ adb pull /d/tracing/trace

# Take a bug report at this time.
$ adb bugreport > bugreport.txt
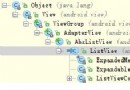 ListView(1)控件架構與ArrayAdapter詳解
ListView是Android開發中比較常用的一個組件,它以列表的形式展示信息,並能根據信息的長度自適應顯示。比如說我們手機裡的通訊錄就用到了ListView顯示聯系人
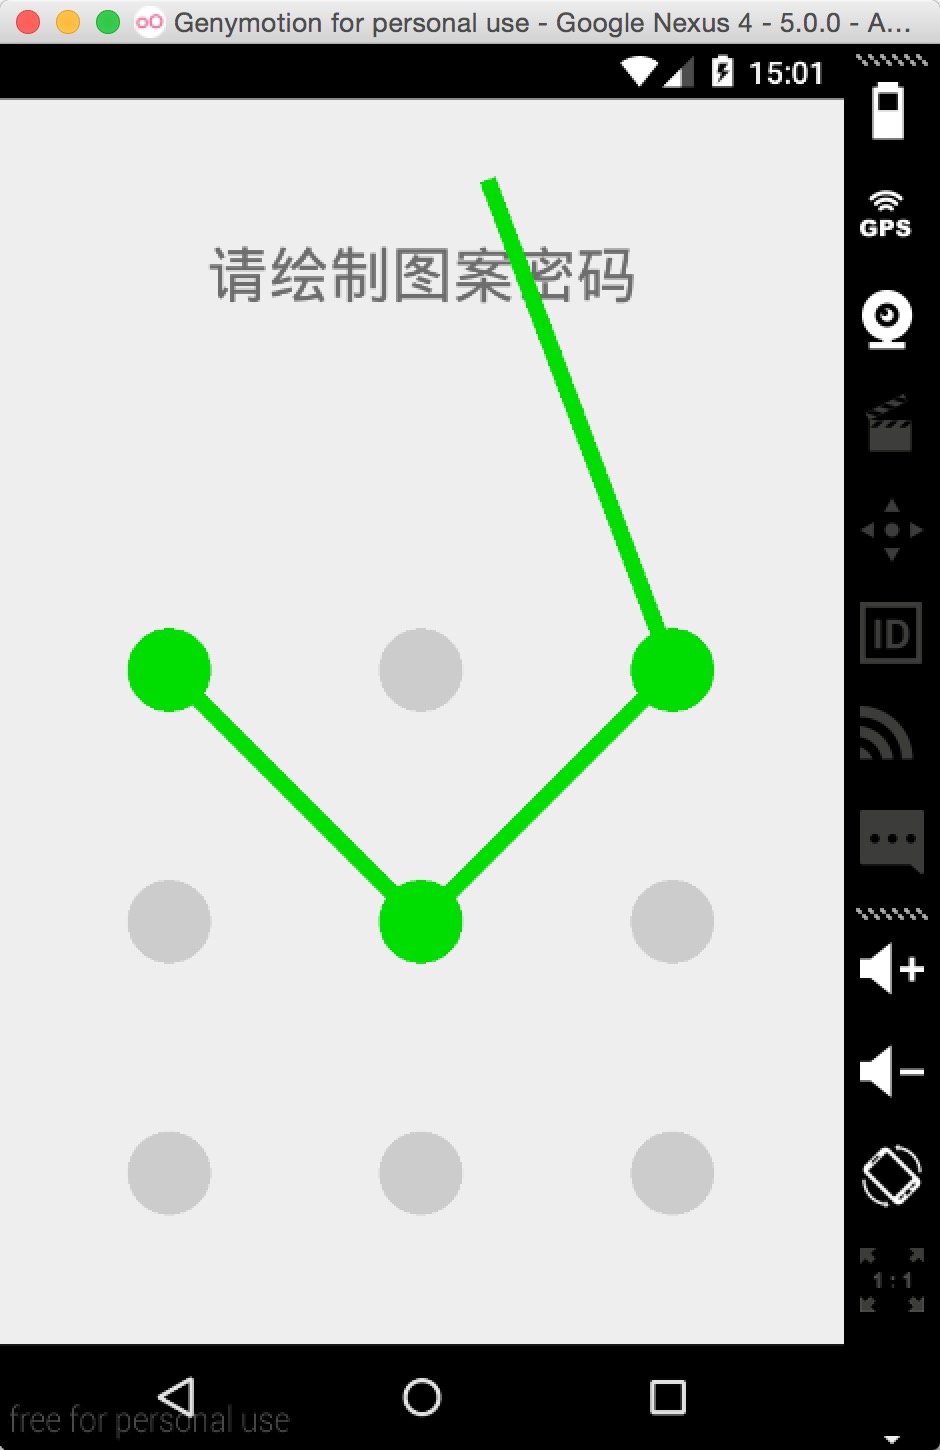
 首頁-底部Tab導航(菜單欄)的實現:FragmentTabHost+ViewPager+Fragment
前言Android開發中使用底部菜單欄的頻次非常高,主要的實現手段有以下:- TabWidget- 隱藏TabWidget,使用RadioGroup和RadioButto
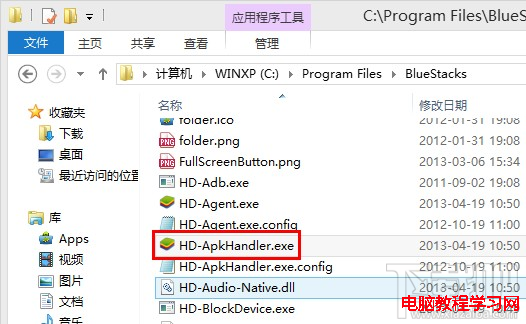 Bluestacks安裝本地APK應用圖解教程
Bluestacks安卓模擬器要怎麼安裝自己下載到電腦上的本地APK文件呢?如果你沒有安裝360助手之類的軟件,Bluestacks默認會關聯電腦上的APK
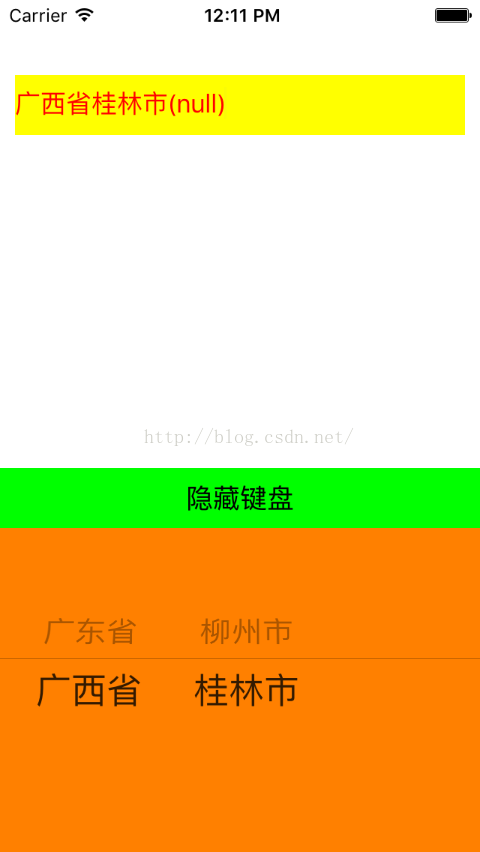 UIPickerView的使用
UIPickerView功能與UIDatePicker類似初始化實例時,通常只需要設置原點坐標,不需要設置寬高(默認寬高為:frame = (0 0; 320 216))