ELK Stack最新版本測試二配置篇
閱讀本文前請浏覽
詳細配置如下:
http://blog.chinaunix.net/uid-25057421-id-5567766.html
一,客戶端
1,nginx日志格式
log_format logstash_json '{ "@timestamp": "$time_iso8601", '
'"host": "$server_addr", '
'"clientip": "$remote_addr", '
'"size": $body_bytes_sent, '
'"responsetime": $request_time, '
'"upstreamtime": "$upstream_response_time", '
'"upstreamhost": "$upstream_addr", '
'"http_host": "$host", '
'"url": "$uri", '
'"referrer": "$http_referer", '
'"xff": "$http_x_forwarded_for", '
'"agent": "$http_user_agent", '
'"status": "$status"} ';
access_log /data/wwwlogs/access_jerrymin.test.com.log logstash_json;
2,fielbeat配置文件
filebeat:
prospectors:
-
- /data/wwwlogs/access_jerrymin.test.com.log
doucmenttype:jerrymin.test.com
output:
logstash:
enabled: true
hosts: ["192.168.0.58:5044"]
shipper:
3,topbeat配置文件
input:
# In seconds, defines how often to read server statistics
period: 10
# Regular expression to match the processes that are monitored
# By default, all the processes are monitored
procs: [".*"]
# Statistics to collect (all enabled by default)
stats:
system: true
proc: true
filesystem: true
output:
### Elasticsearch as output
elasticsearch:
hosts: ["192.168.0.58:9200"]
shipper:
logging:
files:
rotateeverybytes: 10485760 # = 10MB
二,服務端配置
1,logstash配置文件
[root@localhost logstash]# cat /etc/logstash/conf.d/nginxconf.json
input {
beats {
port => 5044
codec => json
}
}
filter {
mutate {
split => [ "upstreamtime", "," ]
}
mutate {
convert => [ "upstreamtime", "float" ]
}
}
output {
elasticsearch {
hosts => "192.168.0.58:9200"
sniffing => true
manage_template => false
# index => "%{[@metadata][beat]}-%{+YYYY.MM.dd}"
index => "filebeat-%{type}-%{+YYYY.MM.dd}"
document_type => "%{[@metadata][type]}"
}
}
2,elasticsearch配置文件
[root@localhost logstash]# cat /etc/elasticsearch/elasticsearch.yml |grep -Ev "^#|^$"
path.data: /data
path.logs: /data/elklogs
network.host: 192.168.0.58
http.port: 9200
3,kibana配置文件
[root@localhost config]# cat /var/kibana/config/kibana.yml
# Kibana is served by a back end server. This controls which port to use.
server.port: 5601
# The host to bind the server to.
server.host: "0.0.0.0"
# The Elasticsearch instance to use for all your queries.
elasticsearch.url: "http://192.168.0.58:9200"
三,Tengine反向代理配置
cat /usr/local/nginx/conf/vhosts_all/kibana.conf
server
{
listen 8888;
server_name 192.168.0.58
index index.html index.shtml;
location / {
proxy_pass http://localhost:5601;
proxy_http_version 1.1;
proxy_set_header Upgrade $http_upgrade;
proxy_set_header Connection 'upgrade';
proxy_set_header Host $host;
proxy_cache_bypass $http_upgrade;
auth_basic "Please input Username and Password";
auth_basic_user_file /usr/local/nginx/conf/.pass_file;
}
access_log /data/wwwlogs/access.kibana.log access;
}
四,登陸平台
http://192.168.0.58:8888
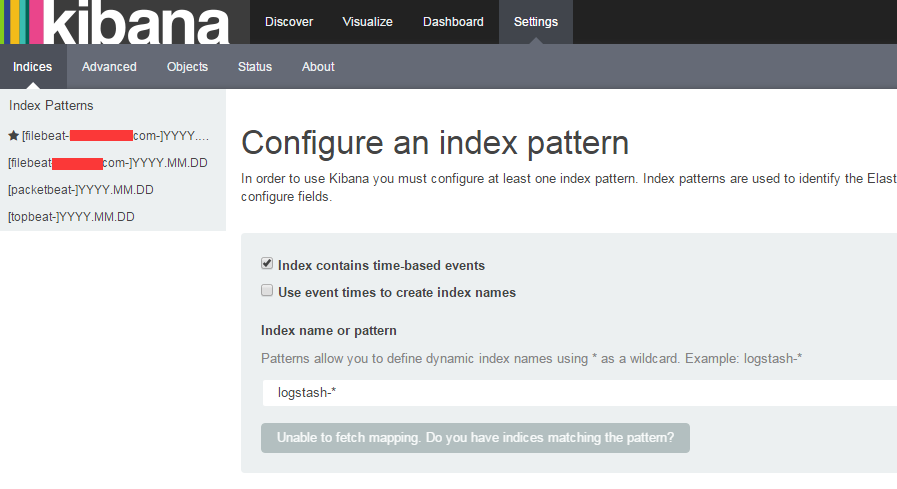
1,創建索引
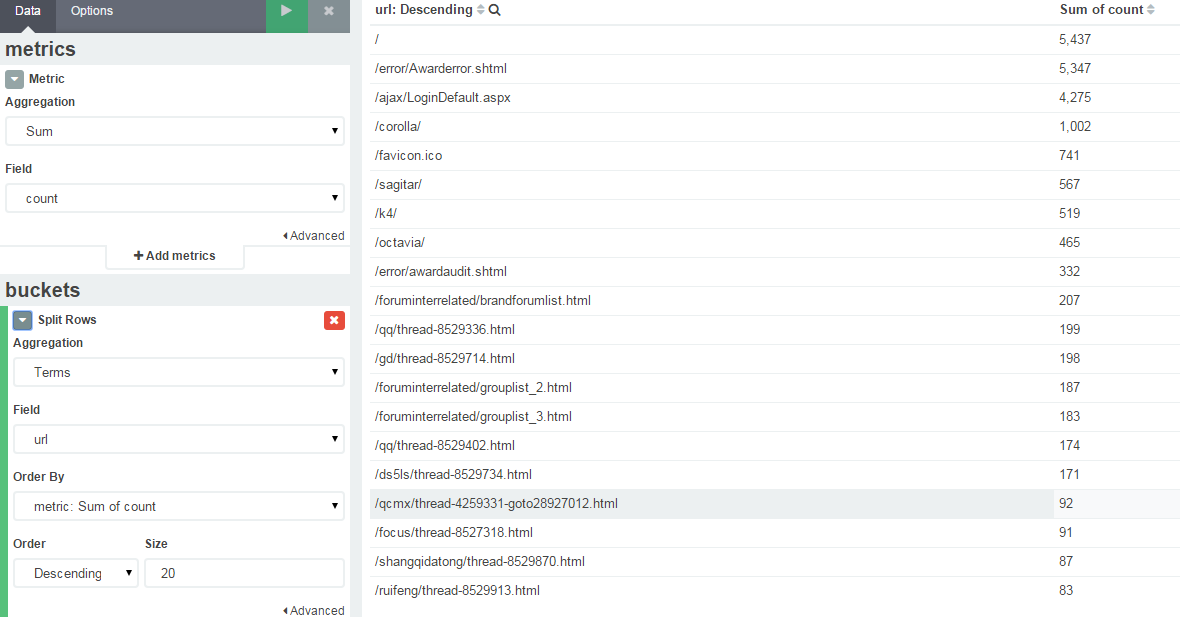
2,創建視圖
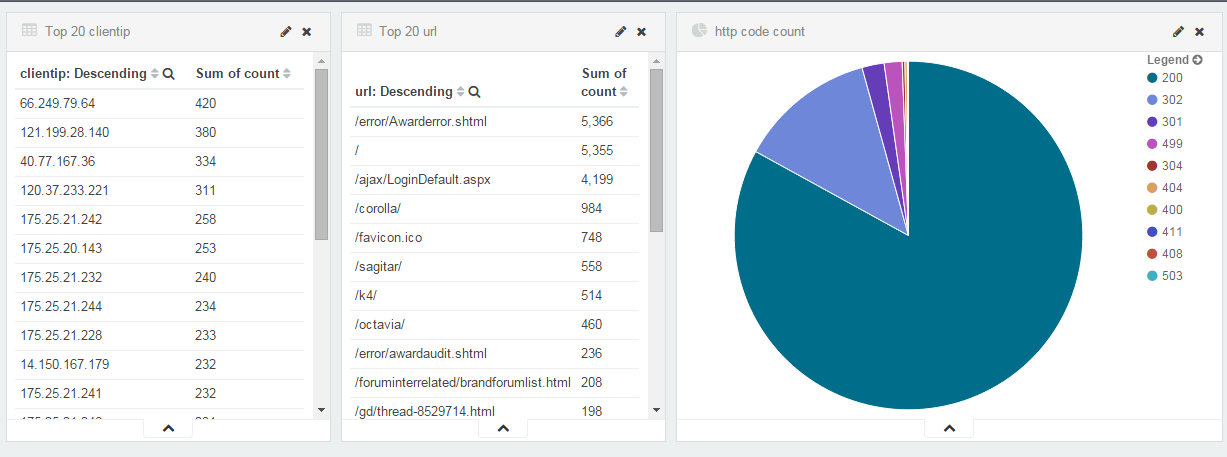
3,創建面板
 Android 四大組件之再論BroadCast,androidbroadcast
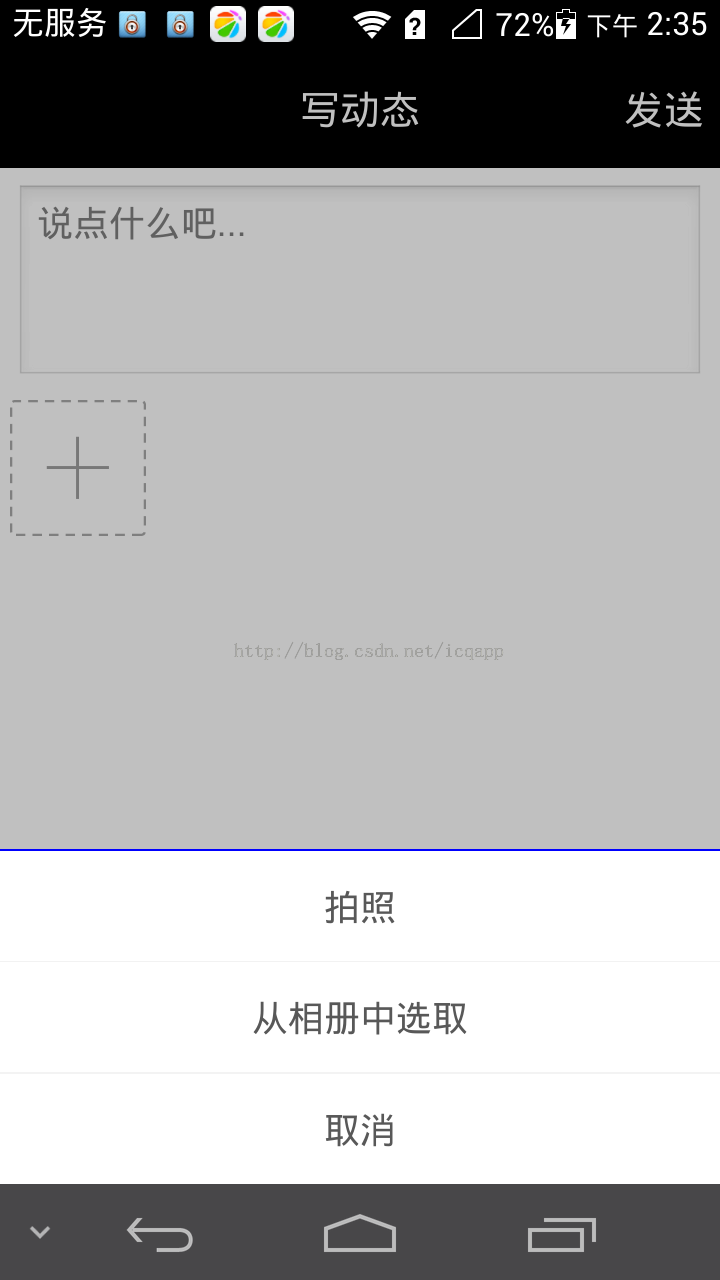 android高仿微信拍照、多選、預覽、刪除(去除相片)相冊功能
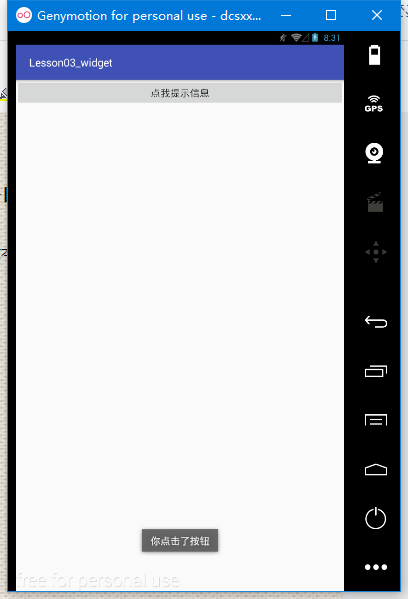 Android表單UI及相應控件的事件處理,android表單ui控件
 Android中使用開源框架android-image-indicator實現圖片輪播部署,
 [FastDev4Android框架開發]神器ViewGragHelper完全解析,媽媽再也不擔心我自定義ViewGroup滑動View操作啦~(三十三)