編輯:關於Android編程
Android系統自帶一個實用的程序異常退出的診斷daemon debuggerd。此進程可以偵測到程序崩潰,並將崩潰時的進程狀態信息輸出到文件和串口中,以供開發人員分析調試使用。Debuggerd的數據被保存在/data/tombstone/目錄下,共可保存10個文件,當超過10個時,會覆蓋重寫最早生產的文件。串口中,則直接用DEBUG的tag,輸出logcat信息。 Linux kernel有自己的一套signal機制,在應用程序崩潰時,通常系統內核都會發送signal到出問題的進程,以通知進程出現什麼異常,這些進程可以捕獲這些signal並對其做相應的處理。通常對於程序異常信號的處理,就是退出。Android在此機制上實現了一個更實用的功能:攔截這些信號,dump進程信息以供調試。
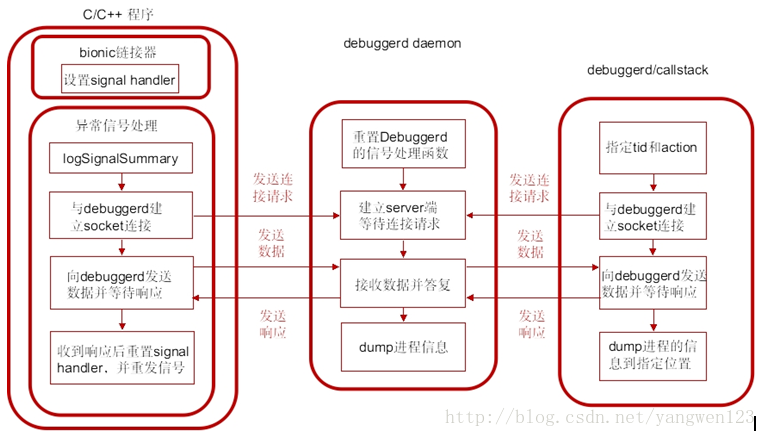
debuggerd創建一個名為 “Android:debuggerd”的socket,作為server端等待其他client端進程的連接,接收client端進程發送來的tid和action信息將由tid指定的那個進程的運行信息,按照由action指定的動作dump到文件或者控制台中可以作為debuggerd的client端的進程主要有幾種:
1. 異常的C/C++程序
這種程序由bionic的linker安裝異常信號的處理函數,當程序產生異常信號時,進入信號處理函數,與debuggerd建立。
2. debuggerd程序
debuggerd可以在控制台中以命令debuggerd -b [
3. dumpstate
控制台中運行命令dumpstate,並指定必要的參數,命令中會調用dump_backtrace_to_file與debuggerd交互。
產生異常信號的C/C++程序與debuggerd建立連接後,debuggerd將進程信息dump到tombstone_XX文件中保存到/data/tombstone/文件夾下。可通過查看tombstone_XX分析異常進程的堆棧信息。
在控制台中以命令debuggerd -b [
應用程序入口屬於bionic實現的一部分,則對所有android的程序有效。在應用程序入口地址__start後,__linker_init中調用debugger_init()函數來注冊異常信號處理handler,以實現攔截系統異常的幾個singal:SIGILL,SIGABRT, SIGBUS, SIGFPE,SIGSEGV和SIGPIPE:
linker/arch/arm/begin.S
start:
        mov     r0, sp
        mov     r1, #0
        bl      __linker_init
bionic\linker\ Linker.cpp
extern "C" Elf32_Addr __linker_init(void* raw_args) {
  …
  Elf32_Addr start_address = __linker_init_post_relocation(args, linker_addr);
  set_soinfo_pool_protection(PROT_READ);
  // Return the address that the calling assembly stub should jump to.
  return start_address;
}
static Elf32_Addr __linker_init_post_relocation(KernelArgumentBlock& args, Elf32_Addr linker_base) {
     ...
    debuggerd_init();
     ...
}
bionic\linker\Debugger.c
void debugger_init()
{
    struct sigaction act;
    memset(&act, 0, sizeof(act));
    act.sa_sigaction = debugger_signal_handler;
    act.sa_flags = SA_RESTART | SA_SIGINFO;
    sigemptyset(&act.sa_mask);
    sigaction(SIGILL, &act, NULL);
    sigaction(SIGABRT, &act, NULL);
    sigaction(SIGBUS, &act, NULL);
    sigaction(SIGFPE, &act, NULL);
    sigaction(SIGSEGV, &act, NULL);
    sigaction(SIGSTKFLT, &act, NULL);
    sigaction(SIGPIPE, &act, NULL);
}
bionic庫中的鏈接器會對以下七種信號設置Handler(debugger_signal_handler):
debugger_init中act.sa_flags = SA_RESTART | SA_SIGINFO的涵義:
1) SA_RESTART
如果指定該參數,表示若信號中斷了進程的某個系統調用,則系統自動啟動該系統調用。如果不指定該參數,則被中斷的系統調用返回失敗,錯誤碼為EINTR。這個標志位只要用於處理慢系統調用(可能會被阻塞的系統調用)。比如調用write系統調用寫某個設備被阻塞,這時進程捕獲某個信號且進入相應信號處理函數返回時,該系統調用可能要返回ENINTR錯誤。指定這個參數後,系統調用會重啟,與RETRY_ON_EINTR宏配合使用則可以保證寫操作的完成
2) SA_SIGINFO
如果指定該參數,表示信號附帶的參數(siginfo_t結構體)可以被傳遞到信號處理函數中。
鏈接到bionic庫上的C/C++程序崩潰時,內核會發送相應的signal,進程收到異常信號後,會轉入debugger_signal_handler函數中進行處理。
void debugger_signal_handler(int n, siginfo_t* info, void* unused)
{
    char msgbuf[128];
    unsigned tid;
    int s;

    logSignalSummary(n, info);

    tid = gettid();
	//"android:debuggerd"
    s = socket_abstract_client(DEBUGGER_SOCKET_NAME, SOCK_STREAM);

    if (s >= 0) {
        /* debugger knows our pid from the credentials on the
         * local socket but we need to tell it our tid.  It
         * is paranoid and will verify that we are giving a tid
         * that's actually in our process
         */
        int  ret;
        debugger_msg_t msg;
        msg.action = DEBUGGER_ACTION_CRASH;
        msg.tid = tid;
        RETRY_ON_EINTR(ret, write(s, &msg, sizeof(msg)));
        if (ret == sizeof(msg)) {
            /* if the write failed, there is no point to read on
             * the file descriptor. */
            RETRY_ON_EINTR(ret, read(s, &tid, 1));
            int savedErrno = errno;
            notify_gdb_of_libraries();
            errno = savedErrno;
        }

        if (ret < 0) {
            /* read or write failed -- broken connection? */
            format_buffer(msgbuf, sizeof(msgbuf),
                "Failed while talking to debuggerd: %s", strerror(errno));
            __libc_android_log_write(ANDROID_LOG_FATAL, "libc", msgbuf);
        }

        close(s);
    } else {
        /* socket failed; maybe process ran out of fds */
        format_buffer(msgbuf, sizeof(msgbuf),
            "Unable to open connection to debuggerd: %s", strerror(errno));
        __libc_android_log_write(ANDROID_LOG_FATAL, "libc", msgbuf);
    }

    /* remove our net so we fault for real when we return */
    signal(n, SIG_DFL);

    /*
     * These signals are not re-thrown when we resume.  This means that
     * crashing due to (say) SIGPIPE doesn't work the way you'd expect it
     * to.  We work around this by throwing them manually.  We don't want
     * to do this for *all* signals because it'll screw up the address for
     * faults like SIGSEGV.
     */
    switch (n) {
        case SIGABRT:
        case SIGFPE:
        case SIGPIPE:
        case SIGSTKFLT:
            (void) tgkill(getpid(), gettid(), n);
            break;
        default:    // SIGILL, SIGBUS, SIGSEGV
            break;
    }
}
debugger_signal_handler函數處理流程:
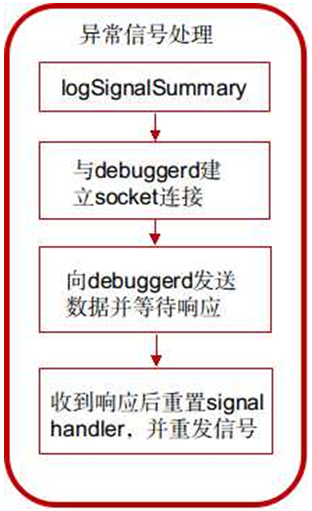
1) 調用logSignalSummary將signal信息寫入文件;
static void logSignalSummary(int signum, const siginfo_t* info)
{
    char buffer[128];
    char threadname[MAX_TASK_NAME_LEN + 1]; // one more for termination
    char* signame;
    switch (signum) {
        case SIGILL:    signame = "SIGILL";     break;
        case SIGABRT:   signame = "SIGABRT";    break;
        case SIGBUS:    signame = "SIGBUS";     break;
        case SIGFPE:    signame = "SIGFPE";     break;
        case SIGSEGV:   signame = "SIGSEGV";    break;
        case SIGSTKFLT: signame = "SIGSTKFLT";  break;
        case SIGPIPE:   signame = "SIGPIPE";    break;
        default:        signame = "???";        break;
    }

    if (prctl(PR_GET_NAME, (unsigned long)threadname, 0, 0, 0) != 0) {
        strcpy(threadname, "");
    } else {
        // short names are null terminated by prctl, but the manpage
        // implies that 16 byte names are not.
        threadname[MAX_TASK_NAME_LEN] = 0;
    }
    format_buffer(buffer, sizeof(buffer),
        "Fatal signal %d (%s) at 0x%08x (code=%d), thread %d (%s)",
        signum, signame, info->si_addr, info->si_code, gettid(), threadname);

    __libc_android_log_write(ANDROID_LOG_FATAL, "libc", buffer);
}
獲取異常信號的名字和thread名字,並格式化字符串,調用函數__libc_android_log_write函數寫入”/dev/log/main”中。
2) 調用socket_abstract_client函數與debuggerd建立socket連接;
s = socket_abstract_client(DEBUGGER_SOCKET_NAME, SOCK_STREAM);
3) 如果連接建立成功,則設置結構體debugger_msg_t,並發送給debuggerd;
msg.action = DEBUGGER_ACTION_CRASH;//告訴debuggerd采取何種行
msg.tid = tid;//線程號
RETRY_ON_EINTR(ret, write(s, &msg, sizeof(msg)));
4) 等待debuggerd的回復,阻塞在下面的調用中,收到回復後接著執行下面的流程;
RETRY_ON_EINTR(ret, read(s, &tid, 1));
5) 重新設置信號處理函數為SIG_DFL,即采取默認的動作;
signal(n, SIG_DFL);
6) 重新發送信號,進程從當前信號處理函數返回後,會處理這個信號,進行默認的信號處理動作,即中斷進程。
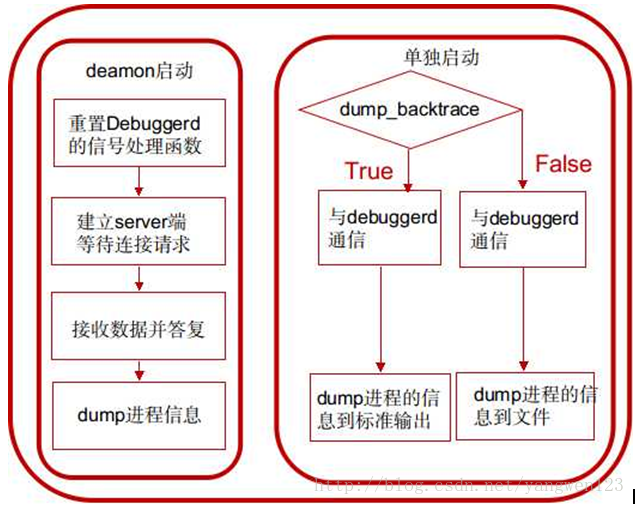
1. 在init進程中以deamon的方式啟動,在init.rc中
service debuggerd /system/bin/debuggerd
class main
以這種方式啟動的話,進入main函數後,將調用do_server函數,作為server端為其他進程提供dump進程信息的服務。
2. 直接運行system/bin/debuggerd可執行文件,需要指定參數,用法為:
debuggerd -b [] //參數-b表示在控制台中輸出backtrace
以這種方式啟動的話,進入main函數後,將調用do_explicit_dump函數與debuggerd daemon通信,將指定進程的信息dump到文件或控制台。
 vcq9PC9oND4KPHByZSBjbGFzcz0="brush:java;">int main(int argc, char** argv) {
if (argc == 1) {
return do_server();
}
}
vcq9PC9oND4KPHByZSBjbGFzcz0="brush:java;">int main(int argc, char** argv) {
if (argc == 1) {
return do_server();
}
}
當啟動debuggerd進程傳遞的參數個數為1時,此時啟動的debuggerd將作為一個後台服務進程,專門接收應用程序異常退出消息而產生tombstone。
static int do_server() {
    int s;
    struct sigaction act;
    int logsocket = -1;

    /*
     * debuggerd crashes can't be reported to debuggerd.  Reset all of the
     * crash handlers.
     */
    signal(SIGILL, SIG_DFL);
    signal(SIGABRT, SIG_DFL);
    signal(SIGBUS, SIG_DFL);
    signal(SIGFPE, SIG_DFL);
    signal(SIGSEGV, SIG_DFL);
    signal(SIGPIPE, SIG_IGN);
    signal(SIGSTKFLT, SIG_DFL);

    logsocket = socket_local_client("logd",
            ANDROID_SOCKET_NAMESPACE_ABSTRACT, SOCK_DGRAM);
    if(logsocket < 0) {
        logsocket = -1;
    } else {
        fcntl(logsocket, F_SETFD, FD_CLOEXEC);
    }

    act.sa_handler = SIG_DFL;
    sigemptyset(&act.sa_mask);
    sigaddset(&act.sa_mask,SIGCHLD);
    act.sa_flags = SA_NOCLDWAIT;
    sigaction(SIGCHLD, &act, 0);

    s = socket_local_server(DEBUGGER_SOCKET_NAME,
            ANDROID_SOCKET_NAMESPACE_ABSTRACT, SOCK_STREAM);
    if(s < 0) return 1;
    fcntl(s, F_SETFD, FD_CLOEXEC);

    LOG("debuggerd: " __DATE__ " " __TIME__ "\n");

    //check corefile limit.
    (void)check_corefile_limit();

    for(;;) {
        struct sockaddr addr;
        socklen_t alen;
        int fd;
        alen = sizeof(addr);
        XLOG("waiting for connection\n");
        fd = accept(s, &addr, &alen);
        if(fd < 0) {
            XLOG("accept failed: %s\n", strerror(errno));
            continue;
        }

        fcntl(fd, F_SETFD, FD_CLOEXEC);

        handle_request(fd);
    }
    return 0;
}
1. 忽略debuggerd自身crash的處理;
2. 建立socket通信的server端;
3. 進入無限循環中,等待並接收客戶端進程連接請求,並通過handle_request()函數處理請求;
static void handle_request(int fd) {
    XLOG("handle_request(%d)\n", fd);

    debugger_request_t request;
    int status = read_request(fd, &request);
    if (!status) {
        XLOG("BOOM: pid=%d uid=%d gid=%d tid=%d\n",
            request.pid, request.uid, request.gid, request.tid);

        /* At this point, the thread that made the request is blocked in
         * a read() call.  If the thread has crashed, then this gives us
         * time to PTRACE_ATTACH to it before it has a chance to really fault.
         *
         * The PTRACE_ATTACH sends a SIGSTOP to the target process, but it
         * won't necessarily have stopped by the time ptrace() returns.  (We
         * currently assume it does.)  We write to the file descriptor to
         * ensure that it can run as soon as we call PTRACE_CONT below.
         * See details in bionic/libc/linker/debugger.c, in function
         * debugger_signal_handler().
         */
        if (ptrace(PTRACE_ATTACH, request.tid, 0, 0)) {
            LOG("ptrace attach failed: %s\n", strerror(errno));
        } else {
            bool detach_failed = false;
            bool attach_gdb = should_attach_gdb(&request);
            if (TEMP_FAILURE_RETRY(write(fd, "\0", 1)) != 1) {
                LOG("failed responding to client: %s\n", strerror(errno));
            } else {
                char* tombstone_path = NULL;

                if (request.action == DEBUGGER_ACTION_CRASH) {
                    close(fd);
                    fd = -1;
                }

                int total_sleep_time_usec = 0;
                for (;;) {
                    int signal = wait_for_signal(request.tid, &total_sleep_time_usec);
                    if (signal < 0) {
                        break;
                    }

                    switch (signal) {
                    case SIGSTOP:
                        if (request.action == DEBUGGER_ACTION_DUMP_TOMBSTONE) {
                            XLOG("stopped -- dumping to tombstone\n");
                            tombstone_path = engrave_tombstone(request.pid, request.tid,
                                    signal, true, true, &detach_failed,
                                    &total_sleep_time_usec);
                        } else if (request.action == DEBUGGER_ACTION_DUMP_BACKTRACE) {
                            XLOG("stopped -- dumping to fd\n");
                            dump_backtrace(fd, request.pid, request.tid, &detach_failed,
                                    &total_sleep_time_usec);
                        } else {
                            XLOG("stopped -- continuing\n");
                            status = ptrace(PTRACE_CONT, request.tid, 0, 0);
                            if (status) {
                                LOG("ptrace continue failed: %s\n", strerror(errno));
                            }
                            continue; /* loop again */
                        }
                        break;

                    case SIGILL:
                    case SIGABRT:
                    case SIGBUS:
                    case SIGFPE:
                    case SIGSEGV:
                    case SIGSTKFLT: {
                        XLOG("stopped -- fatal signal\n");
                        /*
                         * Send a SIGSTOP to the process to make all of
                         * the non-signaled threads stop moving.  Without
                         * this we get a lot of "ptrace detach failed:
                         * No such process".
                         */
                        kill(request.pid, SIGSTOP);
                        /* don't dump sibling threads when attaching to GDB because it
                         * makes the process less reliable, apparently... */
                        tombstone_path = engrave_tombstone(request.pid, request.tid,
                                signal, !attach_gdb, false, &detach_failed,
                                &total_sleep_time_usec);
                        break;
                    }

                    case SIGPIPE:
                        LOG("socket-client process stopped due to SIGPIPE! \n");
                        break;

                    default:
                        XLOG("stopped -- unexpected signal\n");
                        LOG("process stopped due to unexpected signal %d\n", signal);
                        break;
                    }
                    break;
                }

                if (request.action == DEBUGGER_ACTION_DUMP_TOMBSTONE) {
                    if (tombstone_path) {
                        write(fd, tombstone_path, strlen(tombstone_path));
                    }
                    close(fd);
                    fd = -1;
                }
                free(tombstone_path);
            }

            XLOG("detaching\n");
            if (attach_gdb) {
                /* stop the process so we can debug */
                kill(request.pid, SIGSTOP);

                /* detach so we can attach gdbserver */
                if (ptrace(PTRACE_DETACH, request.tid, 0, 0)) {
                    LOG("ptrace detach from %d failed: %s\n", request.tid, strerror(errno));
                    detach_failed = true;
                }

                /*
                 * if debug.db.uid is set, its value indicates if we should wait
                 * for user action for the crashing process.
                 * in this case, we log a message and turn the debug LED on
                 * waiting for a gdb connection (for instance)
                 */
                wait_for_user_action(request.pid);
            } else {
                /* just detach */
                if (ptrace(PTRACE_DETACH, request.tid, 0, 0)) {
                    LOG("ptrace detach from %d failed: %s\n", request.tid, strerror(errno));
                    detach_failed = true;
                }
            }

            /* resume stopped process (so it can crash in peace). */
            kill(request.pid, SIGCONT);

            /* If we didn't successfully detach, we're still the parent, and the
             * actual parent won't receive a death notification via wait(2).  At this point
             * there's not much we can do about that. */
            if (detach_failed) {
                LOG("debuggerd committing suicide to free the zombie!\n");
                kill(getpid(), SIGKILL);
            }
        }

    }
    if (fd >= 0) {
        close(fd);
    }
}
1) 調用read_request函數讀取client端進程發送來的數據:
static int read_request(int fd, debugger_request_t* out_request) {
    struct ucred cr;
    int len = sizeof(cr);
    int status = getsockopt(fd, SOL_SOCKET, SO_PEERCRED, &cr, &len);
    if (status != 0) {
        LOG("cannot get credentials\n");
        return -1;
    }

    XLOG("reading tid\n");
    fcntl(fd, F_SETFL, O_NONBLOCK);

    struct pollfd pollfds[1];
    pollfds[0].fd = fd;
    pollfds[0].events = POLLIN;
    pollfds[0].revents = 0;
    status = TEMP_FAILURE_RETRY(poll(pollfds, 1, 3000));
    if (status != 1) {
        LOG("timed out reading tid\n");
        return -1;
    }

    debugger_msg_t msg;
    status = TEMP_FAILURE_RETRY(read(fd, &msg, sizeof(msg)));
    if (status < 0) {
        LOG("read failure? %s\n", strerror(errno));
        return -1;
    }
    if (status != sizeof(msg)) {
        LOG("invalid crash request of size %d\n", status);
        return -1;
    }

    out_request->action = msg.action;
    out_request->tid = msg.tid;
    out_request->pid = cr.pid;
    out_request->uid = cr.uid;
    out_request->gid = cr.gid;

    if (msg.action == DEBUGGER_ACTION_CRASH) {
        /* Ensure that the tid reported by the crashing process is valid. */
        char buf[64];
        struct stat s;
        snprintf(buf, sizeof buf, "/proc/%d/task/%d", out_request->pid, out_request->tid);
        if(stat(buf, &s)) {
            LOG("tid %d does not exist in pid %d. ignoring debug request\n",
                    out_request->tid, out_request->pid);
            return -1;
        }
    } else if (cr.uid == 0
            || (cr.uid == AID_SYSTEM && msg.action == DEBUGGER_ACTION_DUMP_BACKTRACE)) {
        /* Only root or system can ask us to attach to any process and dump it explicitly.
         * However, system is only allowed to collect backtraces but cannot dump tombstones. */
        status = get_process_info(out_request->tid, &out_request->pid,
                &out_request->uid, &out_request->gid);
        if (status < 0) {
            LOG("tid %d does not exist. ignoring explicit dump request\n",
                    out_request->tid);
            return -1;
        }
    } else {
        /* No one else is not allowed to dump arbitrary processes. */
        return -1;
    }
    return 0;
}
? 從socket中讀取client端進程的pid uid gid
getsockopt(fd, SOL_SOCKET, SO_PEERCRED, &cr, &len);
? 輪詢socket句柄
struct pollfd pollfds[1];
pollfds[0].fd = fd;
pollfds[0].events = POLLIN;
pollfds[0].revents = 0;
status = TEMP_FAILURE_RETRY(poll(pollfds, 1, 3000));
? 從socket上讀取debugger_msg_t結構體
debugger_msg_t msg;
status = TEMP_FAILURE_RETRY(read(fd, &msg, sizeof(msg)));
if (status < 0) {
	LOG("read failure? %s\n", strerror(errno));
	return -1;
}
if (status != sizeof(msg)) {
	LOG("invalid crash request of size %d\n", status);
	return -1;
}
out_request->action = msg.action;
out_request->tid = msg.tid;
out_request->pid = cr.pid;
out_request->uid = cr.uid;
out_request->gid = cr.gid;
? 如果debugger_msg_t中設置的action為DEBUGGER_ACTION_CRASH,說明是crash的C/C++進程發來的請求,則判斷傳進來的tid是否有效。
if (msg.action == DEBUGGER_ACTION_CRASH) {
	/* Ensure that the tid reported by the crashing process is valid. */
	char buf[64];
	struct stat s;
	snprintf(buf, sizeof buf, "/proc/%d/task/%d", out_request->pid, out_request->tid);
	if(stat(buf, &s)) {
		LOG("tid %d does not exist in pid %d. ignoring debug request\n",
				out_request->tid, out_request->pid);
		return -1;
	}
}
? 如果debugger_msg_t中設置的action為DEBUGGER_ACTION_DUMP_BACKTRACE說明是其他方式(debuggerd)發來的請求,則要求必須為root權限或者system權限,然後再判斷tid是否有效。
2) 從read_request返回後,調用ptrace函數attach到tid指定的進程,此時debuggerd將變為被attache進程的父進程,然後ptrace函數會向子進程發送SIGSTOP信號將子進程停下來。此時,父進程有機會檢查子進程核心image和寄存器的值。
ptrace(PTRACE_ATTACH, request.tid, 0, 0)
3) 調用下面的語句給client端子進程回復消息,使clinet端的進程能從read調用中返回。
TEMP_FAILURE_RETRY(write(fd, "\0", 1)
4) 在for循環中等待子進程停止。
int signal = wait_for_signal(request.tid, &total_sleep_time_usec);
5) 子進程根據收到的不同信號、不同的action進行不同的處理
switch (signal) {
	case SIGSTOP:
		if (request.action == DEBUGGER_ACTION_DUMP_TOMBSTONE) {
			XLOG("stopped -- dumping to tombstone\n");
			tombstone_path = engrave_tombstone(request.pid, request.tid,
					signal, true, true, &detach_failed,
					&total_sleep_time_usec);
		} else if (request.action == DEBUGGER_ACTION_DUMP_BACKTRACE) {
			XLOG("stopped -- dumping to fd\n");
			dump_backtrace(fd, request.pid, request.tid, &detach_failed,
					&total_sleep_time_usec);
		} else {
			XLOG("stopped -- continuing\n");
			status = ptrace(PTRACE_CONT, request.tid, 0, 0);
			if (status) {
				LOG("ptrace continue failed: %s\n", strerror(errno));
			}
			continue; /* loop again */
		}
		break;
	case SIGILL:
	case SIGABRT:
	case SIGBUS:
	case SIGFPE:
	case SIGSEGV:
	case SIGSTKFLT: {
		XLOG("stopped -- fatal signal\n");
		kill(request.pid, SIGSTOP);
		tombstone_path = engrave_tombstone(request.pid, request.tid,
				signal, !attach_gdb, false, &detach_failed,
				&total_sleep_time_usec);
		break;
	}
	case SIGPIPE:
		LOG("socket-client process stopped due to SIGPIPE! \n");
		break;
	default:
		XLOG("stopped -- unexpected signal\n");
		LOG("process stopped due to unexpected signal %d\n", signal);
		break;
}
?子進程收到SIGSTOP說明進程並沒有發生crash,根據action不同將進程信息寫入tombstone文件。
?子進程收到七種異常信號說明是進程發生crash,調用engrave_tombstone直接將dump的信息寫到tombstone。
6) 調用ptrace(PTRACE_DETACH, request.tid, 0, 0)解除對子進程的追蹤;
if (attach_gdb) {
	kill(request.pid, SIGSTOP);
	if (ptrace(PTRACE_DETACH, request.tid, 0, 0)) {
		LOG("ptrace detach from %d failed: %s\n", request.tid, strerror(errno));
		detach_failed = true;
	}
	wait_for_user_action(request.pid);
} else {
	if (ptrace(PTRACE_DETACH, request.tid, 0, 0)) {
		LOG("ptrace detach from %d failed: %s\n", request.tid, strerror(errno));
		detach_failed = true;
	}
}
如果運行了類似以下指令:adb shell setprop debug.db.uid 10000;則所有uid<10000的進程發生crash的時候attach_gdb為true,將停止crash進程,並調用ptrace(PTRACE_DETACH, request.tid, 0, 0) 解除對crash進程的追蹤後,開始等待gdb的連接。
adb forward tcp:5039 tcp:5039
adb shell gdbserver :5039 --attach pid &
用戶按下HOME或者VOLUME DOWN按鍵,可以使進程繼續進行,自然crash
attach_gdb為false時,只會解除對子進程的追蹤。
7) 調用kill(request.pid, SIGCONT)恢復被停止的子進程,並讓其自然終止;
char* engrave_tombstone(pid_t pid, pid_t tid, int signal,
        bool dump_sibling_threads, bool quiet, bool* detach_failed,
        int* total_sleep_time_usec) {
    mkdir(TOMBSTONE_DIR, 0755);
    chown(TOMBSTONE_DIR, AID_SYSTEM, AID_SYSTEM);

    //dump maps & check corefile limit .
    dump_creash_maps(pid);  //creat maps file

    int fd;
    char* path = find_and_open_tombstone(&fd);
    if (!path) {
        *detach_failed = false;
        return NULL;
    }

    log_t log;
    log.tfd = fd;
    log.quiet = quiet;
    *detach_failed = dump_crash(&log, pid, tid, signal, dump_sibling_threads,
            total_sleep_time_usec);

    close(fd);
    return path;
}
對於crash的C/C++進程,主要通過這個函數dump進程信息
1.創建”/data/tombstones”文件夾並修改權限
2.調用函數find_and_open_tombstone,tombstone_XX文件最多10個,超過則覆蓋最早的
3.調用dump_crash將所有信息dump到tombstone文件:
? dump_build_info(log);
? dump_thread_info(log, pid, tid, true);
? dump_fault_addr(log, tid, signal);
? dump_thread(context, log, tid, true, total_sleep_time_usec) dump進程的上下文信息
? dump_logs(log, pid, true);
? dump_sibling_thread_report(context, log, pid, tid, total_sleep_time_usec);
void dump_backtrace(int fd, pid_t pid, pid_t tid, bool* detach_failed,
        int* total_sleep_time_usec) {
    log_t log;
    log.tfd = fd;
    log.quiet = true;

    ptrace_context_t* context = load_ptrace_context(tid);
    dump_process_header(&log, pid);
    dump_thread(&log, tid, context, true, detach_failed, total_sleep_time_usec);

    char task_path[64];
    snprintf(task_path, sizeof(task_path), "/proc/%d/task", pid);
    DIR* d = opendir(task_path);
    if (d) {
        struct dirent debuf;
        struct dirent *de;
        while (!readdir_r(d, &debuf, &de) && de) {
            if (!strcmp(de->d_name, ".") || !strcmp(de->d_name, "..")) {
                continue;
            }

            char* end;
            pid_t new_tid = strtoul(de->d_name, &end, 10);
            if (*end || new_tid == tid) {
                continue;
            }

            dump_thread(&log, new_tid, context, false, detach_failed, total_sleep_time_usec);
        }
        closedir(d);
    }

    dump_process_footer(&log, pid);
    free_ptrace_context(context);
}
? dump_process_header(&log, pid);
? dump_thread(&log, tid, context, true, detach_failed, total_sleep_time_usec);
? dump_process_footer(&log, pid);
int main(int argc, char** argv) {
    bool dump_backtrace = false;
    bool have_tid = false;
    pid_t tid = 0;
    for (int i = 1; i < argc; i++) {
        if (!strcmp(argv[i], "-b")) {
            dump_backtrace = true;
        } else if (!have_tid) {
            tid = atoi(argv[i]);
            have_tid = true;
        } else {
            usage();
            return 1;
        }
    }
    if (!have_tid) {
        usage();
        return 1;
    }
    return do_explicit_dump(tid, dump_backtrace);
}
通過do_explicit_dump函數dump出指定進程的棧信息等
static int do_explicit_dump(pid_t tid, bool dump_backtrace) {
    fprintf(stdout, "Sending request to dump task %d.\n", tid);

    if (dump_backtrace) {
        fflush(stdout);
        if (dump_backtrace_to_file(tid, fileno(stdout)) < 0) {
            fputs("Error dumping backtrace.\n", stderr);
            return 1;
        }
    } else {
        char tombstone_path[PATH_MAX];
        if (dump_tombstone(tid, tombstone_path, sizeof(tombstone_path)) < 0) {
            fputs("Error dumping tombstone.\n", stderr);
            return 1;
        }
        fprintf(stderr, "Tombstone written to: %s\n", tombstone_path);
    }
    return 0;
}
? dump_backtrace_to_file(tid, fileno(stdout))
? dump_tombstone(tid, tombstone_path, sizeof(tombstone_path))
 Android跳轉到通訊錄獲取用戶名稱和手機號碼的實現思路
效果圖如下所示:先給大家說下實現android 跳轉到通訊錄的實現思路:1.點擊跳轉到通訊錄界面2.獲取通訊錄姓名和手機號碼3.回調顯示姓名和手機號碼1首先是跳轉到通訊錄
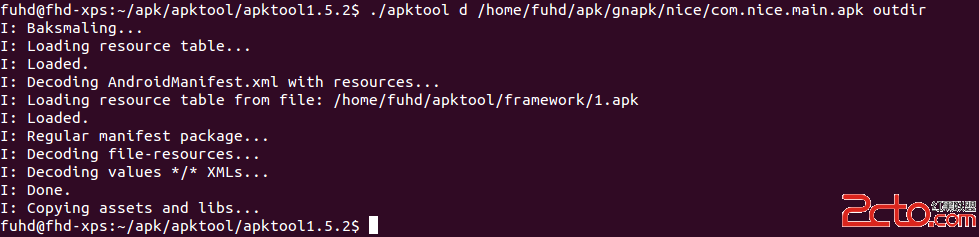 分析Android程序之破解第一個程序
破解Android程序通常的方法是將apk文件利用ApkTool反編譯,生成Smali格式的反匯編代碼,然後閱讀Smali文件的代碼來理解程序的運行機制,找到
 Android學習路線(二十四)ActionBar Fragment運用最佳實踐
通過前面的幾篇博客,大家看到了Google是如何解釋action bar和fragment以及推薦的用法。俗話說沒有demo的博客不是好博客,下面我會介紹一
 Android布局優化之ViewStub、include、merge使用與源碼分析
在開發中UI布局是我們都會遇到的問題,隨著UI越來越多,布局的重復性、復雜度也會隨之增長。Android官方給了幾個優化的方法,但是網絡上的資料基本上都是對官方資料的翻譯