編輯:關於Android編程
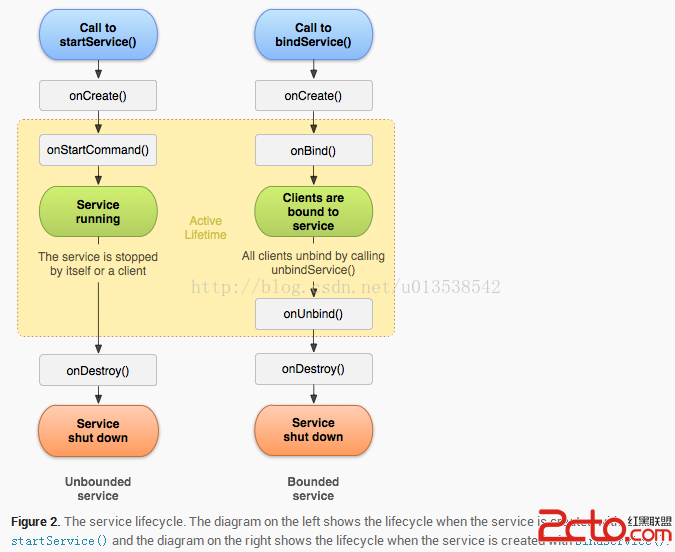
SurfaceFlinger 是 Android 的一個服務,運行在 Android 的System 進程中,負責管理系統的幀緩沖區,繪制應用程序的UI。Android應用程序會請求SurfaceFlinger服務創建Surface,在上面繪制自己的UI,然後將這個已經繪制好了UI的Surface渲染到設備顯示屏上去
$ adb shell dumpsys SurfaceFlinger --latency-clear
[void android::SurfaceFlinger::setMTKProperties(android::String8&)]
========================================================================
[AOSP part]
   debug.sf.showupdates (mDebugRegion): 0
   debug.sf.ddms (mDebugDDMS): 0
[MTK SF part]
   debug.sf.busyswap (mBusySwap): 0
   debug.sf.log_repaint (mLogRepaint): 0
   debug.sf.log_buffer (mLogBuffer): 0
   debug.sf.line_g3d (mLineG3D): 0
   debug.sf.line_ss (mLineScreenShot): 0
   debug.sf.dump_ss (mDumpScreenShot): 0
   debug.sf.slowmotion (mDelayTime): 0
   debug.sf.contbufsenable (mContBufsDump): 0
[MTK GUI part]
   debug.bq.line: 0
   debug.st.line: 0
[MTK HWC part]
   debug.sf.line_ovl: 0
   debug.sf.debug_oex: 0
========================================================================
$ adb shell dumpsys SurfaceFlinger --list


[void android::SurfaceFlinger::setMTKProperties(android::String8&)]
========================================================================
[AOSP part]
   debug.sf.showupdates (mDebugRegion): 0
   debug.sf.ddms (mDebugDDMS): 0
[MTK SF part]
   debug.sf.busyswap (mBusySwap): 0
   debug.sf.log_repaint (mLogRepaint): 0
   debug.sf.log_buffer (mLogBuffer): 0
   debug.sf.line_g3d (mLineG3D): 0
   debug.sf.line_ss (mLineScreenShot): 0
   debug.sf.dump_ss (mDumpScreenShot): 0
   debug.sf.slowmotion (mDelayTime): 0
   debug.sf.contbufsenable (mContBufsDump): 0
[MTK GUI part]
   debug.bq.line: 0
   debug.st.line: 0
[MTK HWC part]
   debug.sf.line_ovl: 0
   debug.sf.debug_oex: 0
========================================================================


DimSurface
com.android.systemui.ImageWallpaper
com.tmall.wireless/com.tmall.wireless.maintab.module.TMMainTabActivity
com.tmall.wireless/com.tmall.wireless.module.category.TMNewCategoryActivity
com.tmall.wireless/com.tmall.wireless.module.search.searchResult.TMSearchResultActivity
DimAnimator
StatusBar
越下面的窗口,越在上層。如我要找天貓打開的Activity, 就取得包名為 com.tmall.wireless 的最後一條數據 xxx.TMSearchResultActivity
$ adb shell dumpsys SurfaceFlinger --latency com.tmall.wireless/com.tmall.wireless.module.search.searchResult.TMSearchResultActivity


[void android::SurfaceFlinger::setMTKProperties(android::String8&)]
========================================================================
[AOSP part]
   debug.sf.showupdates (mDebugRegion): 0
   debug.sf.ddms (mDebugDDMS): 0
[MTK SF part]
   debug.sf.busyswap (mBusySwap): 0
   debug.sf.log_repaint (mLogRepaint): 0
   debug.sf.log_buffer (mLogBuffer): 0
   debug.sf.line_g3d (mLineG3D): 0
   debug.sf.line_ss (mLineScreenShot): 0
   debug.sf.dump_ss (mDumpScreenShot): 0
   debug.sf.slowmotion (mDelayTime): 0
   debug.sf.contbufsenable (mContBufsDump): 0
[MTK GUI part]
   debug.bq.line: 0
   debug.st.line: 0
[MTK HWC part]
   debug.sf.line_ovl: 0
   debug.sf.debug_oex: 0
========================================================================


17340038
1812193316205 1812209665589 1812210614128
1812212222282 1812227121282 1812227918128
1812239753051 1812261917205 1812262521667
1812273201051 1812296490820 1812297217743
...
...
1815880321744 1815896512436 1815897669128
1815897796051 1815913973205 1815915028282
1815915093359 1815931327974 1815932468974
1815933351974 1815948728436 1815949869743
說明:
刷新頻率: 17340038
1 18121933162051812209665589 1812210614128
2 18122122222821812227121282 1812227918128
3 18122397530511812261917205 1812262521667
…
…
127 18159150933591815931327974 1815932468974
128 18159333519741815948728436 1815949869743
The first line currently contains the refresh period in nanosecond.
第一行是刷新頻率,後面有128行,每行3個時間戳。
Each 128 following line contains 3 timestamps, of respectively the app draw time , the vsync timestamp just prior the call to set and the timestamp of the call to set.
在 /Users/army/JavaDev/adt_20140702/sdk/sources/android-xx/com/android/uiautomator/platform/SurfaceFlingerHelper.java 中包含 frame rate 的計算方法:
    /**
     * Calculate frame rate
     * @return
     */
    public static double getFrameRate() {
        if (mRefreshPeriod < 0) {
            log(Run command  + FRAME_LATENCY_CMD +   before calcuating average frame rate);
            return -1.0;
        }
        if (mFrameBufferData.get(0) == null) {
            log(Run command  + FRAME_LATENCY_CMD +   before retrieving frame buffer data);
            return -1.0;
        }
        long startTime = Long.parseLong(mFrameBufferData.get(0).get(1));
        long endTime =  Long.parseLong(mFrameBufferData.get(mFrameLatencySampleSize - 1).get(1));
        long totalDuration = endTime - startTime;
        return (double)((mFrameLatencySampleSize - 1) * Math.pow(10, 9))/totalDuration;
    }
在開發者選項中有個“ GPU呈現模式分析(Profile GPU rendering,計算adb shell dumpsys gfxinfo中的呈現時間)”功能,在開啟這個功能後,系統就會記錄保留每個界面最後128幀圖像繪制的相關時間信息。在開啟這個功能後,重新啟動APP,滑動頁面然後執行adb命令。
$ adb shell dumpsys gfxinfo com.tmall.wireless


Applications Graphics Acceleration Info:
Uptime: 386315 Realtime: 386308


** Graphics info for pid 4887 [com.tmall.wireless] **


Recent DisplayList operations
             ClipRect
             DrawText
             RestoreToCount
     RestoreToCount
   DrawPatch
 RestoreToCount
DrawRect
DrawPath
DrawBitmap
DrawText
...
multiDraw
 DrawText
DrawPatch
DrawBitmap
DrawBitmapRect
DrawRect
DrawOval
...
multiDraw
 DrawText
DrawPatch


Caches:
Current memory usage / total memory usage (bytes):
 TextureCache         15078192 / 25165824
 LayerCache             311296 / 16777216
 RenderBufferCache           0 /  2097152
 GradientCache            4096 /   524288
 PathCache             1781076 / 10485760
 TextDropShadowCache         0 /  2097152
 FontRenderer 0         524288 /   524288
Other:
 FboCache                    1 /       16
 PatchCache                  3 /      512
Total memory usage:
 17698948 bytes, 16.88 MB


Profile data in ms:


com.tmall.wireless/com.tmall.wireless.module.search.searchResult.TMSearchResultActivity/android.view.ViewRootImpl@42f81df0
Draw ProcessExecute
1.11 2.490.43
1.26 2.890.63
1.85 4.620.65
1.72 4.163.56
1.88 3.150.46
2.67 2.680.45
1.22 2.670.58
1.22 2.810.42
1.74 2.250.38
102.77 10.32 0.52
2.48 5.480.53
2.19 4.990.56
2.10 4.770.50
1.10 2.550.40
2.26 4.040.47
...


View hierarchy:


 com.tmall.wireless/com.tmall.wireless.maintab.module.TMMainTabActivity/android.view.ViewRootImpl@42d08ee8
 138 views, 62.20 kB of display lists, 1637 frames rendered


 com.tmall.wireless/com.tmall.wireless.module.search.searchResult.TMSearchResultActivity/android.view.ViewRootImpl@42f81df0
 420 views, 82.98 kB of display lists, 862 frames rendered


Total ViewRootImpl: 2
Total Views:        558
Total DisplayList:  145.18 kB
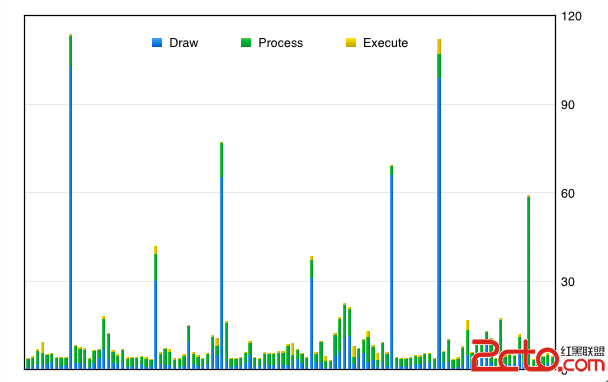
Draw:表示在Java中創建顯示列表部分中,OnDraw()方法占用的時間。
Process:表示渲染引擎執行顯示列表所花的時間,view越多,時間就越長
Execute:表示把一幀數據發送到屏幕上排版顯示實際花費的時間。其實是實際顯示幀數據的後台緩存區與前台緩沖區交換後並將前台緩沖區的內容顯示到屏幕上的時間。
Draw + Process + Execute = 完整顯示一幀 ,這個時間要小於16ms才能保存每秒60幀。
取得數據後,復制到excel中生成堆積柱狀圖.
圖中可以清晰的看出在滑動時,耗時明顯有很多幀超過16ms。這些都是需要結合操作進行優化的。
 百度有錢花怎麼分期 百度有錢花怎麼還款詳細介紹
百度有錢花是百度金融旗下的消費金融品牌,是面向大眾的個人消費金融權益平台,打造創新消費信貸模式,目前已經在多個產業進行探索和布局,其教育信貸業務開通了遠程異
 Android自定義組合控件--底部多按鈕切換
效果圖: 現在市場上大多數軟件都是類似於上面的結構,底部有幾個按鈕用於切換到不同的界面。基於OOP思想,我想把下面的一整塊布局封裝成一個類,也就是我們的自定義組合控件&
 深入理解Android 5.0中的Toolbar
環境說明: Android Studio 2.0 V7包版本:com.android.support:appcompat-v7:23.4.0 compileSdkV
 Android sdcard讀寫權限問題之一
博主在剛剛在學習過程中發現了一個關於android往sdcard讀寫的問題, 配置了該配置的提示無讀寫權限。 在AndroidManifest.xml文件中配置清單如下