編輯:關於Android編程
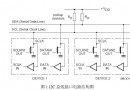
帶觸控的圖表類,後期會把這個功能類,添加到這個框架裡:
效果如下


public class BaseFundChartView extends View implements View.OnTouchListener{

    Paint linePaint;
    Paint textPaint;
    Paint xyChartPaint;
    Paint chartLinePaint;
    Paint chartJianbianPaint;
    Paint huodongPaint;
    Paint huodongPaintText;
    List points;
    public BaseFundChartView(Context context, AttributeSet attrs, int defStyleAttr) {
        super(context, attrs, defStyleAttr);
        init();
    }

    public BaseFundChartView(Context context) {
        this(context, null);
    }

    public BaseFundChartView(Context context, AttributeSet attrs) {
        this(context, attrs, 0);
    }

    PathEffect effect;
    Path path;

    private float getWidthYMax(){
        return getWidth()-15;
    }

    private void init() {
        linePaint = new Paint();
        textPaint = new Paint();
        xyChartPaint = new Paint();
        chartLinePaint = new Paint();
        chartJianbianPaint = new Paint();
        huodongPaint = new Paint();
        huodongPaintText = new Paint();
        //設置繪制模式為-虛線作為背景線。
        effect = new DashPathEffect(new float[] { 6, 6, 6, 6, 6}, 2);
        //背景虛線路徑.
        path = new Path();
        //只是繪制的XY軸
        linePaint.setStyle(Paint.Style.STROKE);
//        linePaint.setStrokeWidth((float) 0.7);
        linePaint.setStrokeWidth((float) 1.0);             //設置線寬

        linePaint.setColor(Color.BLACK);
        linePaint.setAntiAlias(true);// 鋸齒不顯示

        //XY刻度上的字
        textPaint.setStyle(Paint.Style.FILL);// 設置非填充
        textPaint.setStrokeWidth(1);// 筆寬5像素
        textPaint.setColor(Color.BLACK);// 設置為藍筆
        textPaint.setAntiAlias(true);// 鋸齒不顯示
        textPaint.setTextAlign(Paint.Align.CENTER);
        textPaint.setTextSize(15);

        //繪制XY軸上的字:Y開關狀態、X時間
        xyChartPaint.setStyle(Paint.Style.FILL);
        xyChartPaint.setStrokeWidth(1);
        xyChartPaint.setColor(Color.BLUE);
        xyChartPaint.setAntiAlias(true);
        xyChartPaint.setTextAlign(Paint.Align.CENTER);
        xyChartPaint.setTextSize(18);
        //繪制的折線
        chartLinePaint.setStyle(Paint.Style.STROKE);
        chartLinePaint.setStrokeWidth(5);
        chartLinePaint.setColor(Color.BLUE);
        chartLinePaint.setAntiAlias(true);

        //繪制的折線
        chartJianbianPaint.setStyle(Paint.Style.FILL);
        chartJianbianPaint.setStrokeWidth(5);
        //chartJianbianPaint.setColor(Color.YELLOW);

        chartJianbianPaint.setAntiAlias(true);


        huodongPaint.setStyle(Paint.Style.STROKE);
        huodongPaint.setStrokeWidth((float) 3.0);             //設置線寬

        huodongPaint.setColor(Color.GRAY);
        huodongPaint.setAntiAlias(true);// 鋸齒不顯示

        huodongPaintText.setStyle(Paint.Style.STROKE);
        huodongPaintText.setStrokeWidth((float) 2.0);             //設置線寬
        huodongPaintText.setTextSize(40);
        huodongPaintText.setColor(Color.GRAY);
        huodongPaintText.setAntiAlias(true);// 鋸齒不顯示

        setOnTouchListener(this);
    }

    /**
     * 重要參數,兩點之間分為幾段描畫,數字愈大分段越多,描畫的曲線就越精細.
     */
    private static final int STEPS = 12;

    float gridX,gridY,xSpace = 0,ySpace = 0,spaceYT = 0;
    Float yStart=null,yStop = null;
    Integer yCount = null;

    List text = null;

    public void setText(List text) {
        this.text = text;
    }

    public void setyCount(Integer yCount) {
        this.yCount = yCount;
    }

    public void setyStart(Float yStart) {
        this.yStart = yStart;
    }

    public void setyStop(Float yStop) {
        this.yStop = yStop;
    }

    String yFormat=null;

    public void setFormat(String yFormat){
        this.yFormat = yFormat;
    }

    List dateX = null;
    List dateY = null;

    List> data = null;

    List colors = null;

    public void setColors(List colors) {
        this.colors = colors;
    }

    public List getDateY() {
        return dateY;
    }

    public void setDateY(List dateY) {
        this.dateY = dateY;
    }

    public List> getData() {
        return data;
    }

    public void setData(List> data) {
        this.data = data;
    }

    public List getDateX() {
        return dateX;
    }

    public void setDateX(List dateX) {
        this.dateX = dateX;
    }

    @Override
    protected void onDraw(Canvas canvas) {
        super.onDraw(canvas);

        //基准點。
        gridX = 40;
        gridY = getHeight() - 50;
        //XY間隔。
        if(dateX!=null&&dateX.size()>0){
            xSpace = (getWidthYMax() - gridX)/dateX.size();
        }
        /**
         * 如果設置開頭和結尾的話,就直接生成y軸
         */
        if(yStart!=null&&yStop!=null&&yCount!=null){
            dateY = new ArrayList<>();
            ySpace = (gridY - 70)/yCount;
            float ze = (yStop-yStart)/yCount;
            for(int i=0;i2){
                spaceYT = dateY.get(1)-dateY.get(0);
            }
        }else{
            if(dateY!=null&&dateY.size()>0){
                ySpace = (gridY - 70)/dateY.size();
                yStart = dateY.get(0);
                if(dateY.size()>2){
                    spaceYT = dateY.get(1)-dateY.get(0);
                }
            }
        }


        UIUtils.log("rewqfdesa",gridY,"fdsafdsa");

        //畫Y軸(帶箭頭)。
        canvas.drawLine(gridX, gridY - 20 - 10, gridX,  10, linePaint);
        canvas.drawLine(gridX,  10, gridX - 6, 14 + 10, linePaint);//Y軸箭頭。
        canvas.drawLine(gridX,  10, gridX + 6, 14 + 10, linePaint);


        //畫Y軸名字。
        //由於是豎直顯示的,先以原點順時針旋轉90度後為新的坐標系
        //canvas.rotate(-90);
        //當xyChartPaint的setTextAlign()設置為center時第二、三個參數代表這四個字中點所在的xy坐標

        //canvas.drawText("開關狀態", -((float) (getHeight() - 60) - 15 - 5 - 1 / ((float) 1.6 * 1) * (getHeight() - 60) / 2), gridX - 15, xyChartPaint);
        //繪制Y軸坐標


        //canvas.rotate(90); //改變了坐標系還要再改過來
        float y = 0;
        //畫X軸。
        y = gridY - 20;
        canvas.drawLine(gridX, y - 10, getWidthYMax(), y - 10, linePaint);//X軸.
        canvas.drawLine(getWidthYMax(), y - 10, getWidthYMax() - 14, y - 6 - 10, linePaint);//X軸箭頭。
        canvas.drawLine(getWidthYMax(), y - 10, getWidthYMax() - 14, y + 6 - 10, linePaint);

        //繪制X刻度坐標。
        float x = 0;
        if(dateX!=null){
            for (int n = 0; n < dateX.size(); n++) {
                //取X刻度坐標.
                x = gridX + (n) * xSpace;//在原點(0,0)處也畫刻度(不畫的話就是n+1),向右移動一個跨度。
                //畫X軸具體刻度值。
                if (dateX.get(n) != null) {
                    //canvas.drawLine(x, gridY - 30, x, gridY - 18, linePaint);//短X刻度。
                    canvas.drawText(dateX.get(n), x, gridY + 5, textPaint);//X具體刻度值。
                }
            }
        }

        float my = 0;

        if(dateY!=null){

            for(int n=0;n0){
            float lastPointX = 0; //前一個點
            float lastPointY = 0;
            float currentPointX = 0;//當前點
            float currentPointY = 0;
            for(int n=0;n da = data.get(n);
                List da_x = new ArrayList<>();
                List da_y = new ArrayList<>();
                /**
                 * 曲線路勁
                 */
                Path curvePath = new Path();
                /**
                 * 漸變色路徑
                 */
                Path jianBianPath = new Path();

                for(int m=0;m0){
//                        canvas.drawLine(lastPointX, lastPointY, currentPointX, currentPointY, chartLinePaint);
//                    }
//                    lastPointX = currentPointX;
//                    lastPointY = currentPointY;
                }
                List calculate_y = calculate(da_y);
                List calculate_x = calculate(da_x);
                curvePath.moveTo(calculate_x.get(0).eval(0), calculate_y.get(0).eval(0));
                jianBianPath.moveTo(gridX,gridY - 20 - 10);
                jianBianPath.lineTo(calculate_x.get(0).eval(0), calculate_y.get(0).eval(0));
                chartLinePaint.setColor(colors.get(n));
                float lastx = 0;
                for (int i = 0; i < calculate_x.size(); i++) {
                    for (int j = 1; j <= STEPS; j++) {
                        float u = j / (float) STEPS;
                        curvePath.lineTo(calculate_x.get(i).eval(u), calculate_y.get(i)
                                .eval(u));
                        jianBianPath.lineTo(calculate_x.get(i).eval(u), calculate_y.get(i)
                                .eval(u));
                        lastx = calculate_x.get(i).eval(u);
                    }
                }
                jianBianPath.lineTo(lastx,gridY - 20 - 10);
                canvas.drawPath(curvePath, chartLinePaint);
                Shader mShader = new LinearGradient(0,30 + 10,0,gridY - 20 - 10,new int[] {colors.get(n),Color.TRANSPARENT},null,Shader.TileMode.REPEAT);
//新建一個線性漸變,前兩個參數是漸變開始的點坐標,第三四個參數是漸變結束的點的坐標。連接這2個點就拉出一條漸變線了,玩過PS的都懂。然後那個數組是漸變的顏色。下一個參數是漸變顏色的分布,如果為空,每個顏色就是均勻分布的。最後是模式,這裡設置的是循環漸變

                chartJianbianPaint.setShader(mShader);
                canvas.drawPath(jianBianPath, chartJianbianPaint);
            }
        }

        if(lineX!=null){
            if(text!=null&&text.size()>0){
                Paint.FontMetrics metrics = huodongPaintText.getFontMetrics();
                float top = metrics.top;
                float bootom = metrics.bottom;
                float h = bootom-top;
                float th = h + h*text.size();
                float w=0;
                float fx = 1;
                if(lineX>getWidth()/2){
                    fx = -1;
                }else{
                    fx = 1;
                }
                for(int i=0;iw){
                        w = width;
                    }
                    canvas.drawText(text.get(i),fx==1?lineX+10:lineX-10-width,40+ h*(i+1),huodongPaintText);
                }
                canvas.drawLine(lineX, gridY - 20 - 10, lineX, 30 + 10, huodongPaint);
                //canvas.drawRect(lineX,40,lineX+w*fx+20*fx,40+th,huodongPaint);
            }
        }


//        //起始點。
//        float lastPointX = 0; //前一個點
//        float lastPointY = 0;
//        float currentPointX = 0;//當前點
//        float currentPointY = 0;
//        if (dateY != null) {
//            //1.繪制折線。
//            for (int n = 0; n < dateY.length; n++) {
//                //get current point
//                currentPointX = n * xSpace + gridX;
//                currentPointY = (float) (getHeight() - 60) - 15 - 5 - (float) dateY[n] / ((float) 1.6 * 1) * (getHeight() - 60);
//                if (dateX[n] != null) {//用X來判斷,就是用來如果剛開始的點數少於7個則從左到右遞增,從而沒有了剛開始的幾個虛點;(因為X和Y的數組初始化時都沒賦值,所以剛開始的時候用這個就可以判斷數組中到底幾個點)
//                    if (n > 0) {//從第二個點開始判斷
//                        if (dateY[n - 1] == dateY[n]) {//如果相鄰兩個點相等一直畫直線
//                            //draw line
//                            canvas.drawLine(lastPointX, lastPointY, currentPointX, currentPointY, chartLinePaint);//第一條線[藍色]
//                        } else {//如果相鄰間的點不相等證明是從開到關或者關到開的狀態,要畫豎線
//                            //draw line  橫線
//                            canvas.drawLine(lastPointX, lastPointY, currentPointX, lastPointY, chartLinePaint);//第一條線[藍色]
//                            //draw line  豎線
//                            canvas.drawLine(currentPointX, lastPointY, currentPointX, currentPointY, chartLinePaint);//第一條線[藍色]
//                        }
//                    }
//                }
//
//                lastPointX = currentPointX;
//                lastPointY = currentPointY;
//            }
//        }


        //畫背景虛線,一條(因為除去了X軸),畫Y軸刻度
 //       y = (float) (getHeight() - 60) - 15 - 5 - 1 / ((float) 1.6 * 1) * (getHeight() - 60);//虛線的Y,開關是開的時候的Y。
//        linePaint.setPathEffect(effect);//設法虛線間隔樣式。
//        //畫除X軸之外的------背景虛線一條-------
//        path.moveTo(gridX, y);//背景【虛線起點】。
//        path.lineTo(getWidth(), y);//背景【虛線終點】。
//        canvas.drawPath(path, linePaint);
//        //畫Y軸刻度。
//        canvas.drawText("關", gridX - 6 - 7, gridY - 20, textPaint);
//        canvas.drawText("開", gridX - 6 - 7, y + 10, textPaint);
//
//        //繪制X刻度坐標。
//        float x = 0;
//        if (dateX[0] != null) { //用X來判斷,就是用來如果剛開始的點數少於7個則從左到右遞增,從而沒有了剛開始的幾個虛點;(因為X和Y的數組初始化時都沒賦值,所以剛開始的時候用這個就可以判斷數組中到底幾個點)
//            for (int n = 0; n < dateX.length; n++) {
//                //取X刻度坐標.
//                x = gridX + (n) * xSpace;//在原點(0,0)處也畫刻度(不畫的話就是n+1),向右移動一個跨度。
//                //畫X軸具體刻度值。
//                if (dateX[n] != null) {
//                    canvas.drawLine(x, gridY - 30, x, gridY - 18, linePaint);//短X刻度。
//                    canvas.drawText(dateX[n], x, gridY + 5, textPaint);//X具體刻度值。
//                }
//            }
//        }
//
//        //起始點。
//        float lastPointX = 0; //前一個點
//        float lastPointY = 0;
//        float currentPointX = 0;//當前點
//        float currentPointY = 0;
//        if (dateY != null) {
//            //1.繪制折線。
//            for (int n = 0; n < dateY.length; n++) {
//                //get current point
//                currentPointX = n * xSpace + gridX;
//                currentPointY = (float) (getHeight() - 60) - 15 - 5 - (float) dateY[n] / ((float) 1.6 * 1) * (getHeight() - 60);
//                if (dateX[n] != null) {//用X來判斷,就是用來如果剛開始的點數少於7個則從左到右遞增,從而沒有了剛開始的幾個虛點;(因為X和Y的數組初始化時都沒賦值,所以剛開始的時候用這個就可以判斷數組中到底幾個點)
//                    if (n > 0) {//從第二個點開始判斷
//                        if (dateY[n - 1] == dateY[n]) {//如果相鄰兩個點相等一直畫直線
//                            //draw line
//                            canvas.drawLine(lastPointX, lastPointY, currentPointX, currentPointY, chartLinePaint);//第一條線[藍色]
//                        } else {//如果相鄰間的點不相等證明是從開到關或者關到開的狀態,要畫豎線
//                            //draw line  橫線
//                            canvas.drawLine(lastPointX, lastPointY, currentPointX, lastPointY, chartLinePaint);//第一條線[藍色]
//                            //draw line  豎線
//                            canvas.drawLine(currentPointX, lastPointY, currentPointX, currentPointY, chartLinePaint);//第一條線[藍色]
//                        }
//                    }
//                }
//
//                lastPointX = currentPointX;
//                lastPointY = currentPointY;
//            }
//        }
//        //畫X軸名字。
//        canvas.drawText("時間", getWidth() / 2 - 10, getHeight() - 18, xyChartPaint);
    }

//    /**
//     * 畫點.
//     *
//     * @param canvas
//     */
//    private void drawPoints(Canvas canvas) {
//        for (int i = 0; i < points.size(); i++) {
//            Point p = points.get(i);
//            canvas.drawCircle(p.x, p.y, 5, paint);
//        }
//    }


    /**
     * 計算曲線.
     *
     * @param x
     * @return
     */
    private List calculate(List x) {
        int n = x.size() - 1;
        float[] gamma = new float[n + 1];
        float[] delta = new float[n + 1];
        float[] D = new float[n + 1];
        int i;
        /*
         * We solve the equation [2 1 ] [D[0]] [3(x[1] - x[0]) ] |1 4 1 | |D[1]|
         * |3(x[2] - x[0]) | | 1 4 1 | | . | = | . | | ..... | | . | | . | | 1 4
         * 1| | . | |3(x[n] - x[n-2])| [ 1 2] [D[n]] [3(x[n] - x[n-1])]
         *
         * by using row operations to convert the matrix to upper triangular and
         * then back sustitution. The D[i] are the derivatives at the knots.
         */

        gamma[0] = 1.0f / 2.0f;
        for (i = 1; i < n; i++) {
            gamma[i] = 1 / (4 - gamma[i - 1]);
        }
        gamma[n] = 1 / (2 - gamma[n - 1]);

        delta[0] = 3 * (x.get(1) - x.get(0)) * gamma[0];
        for (i = 1; i < n; i++) {
            delta[i] = (3 * (x.get(i + 1) - x.get(i - 1)) - delta[i - 1])
                    * gamma[i];
        }
        delta[n] = (3 * (x.get(n) - x.get(n - 1)) - delta[n - 1]) * gamma[n];

        D[n] = delta[n];
        for (i = n - 1; i >= 0; i--) {
            D[i] = delta[i] - gamma[i] * D[i + 1];
        }

        /* now compute the coefficients of the cubics */
        List cubics = new LinkedList();
        for (i = 0; i < n; i++) {
            Cubic c = new Cubic(x.get(i), D[i], 3 * (x.get(i + 1) - x.get(i))
                    - 2 * D[i] - D[i + 1], 2 * (x.get(i) - x.get(i + 1)) + D[i]
                    + D[i + 1]);
            cubics.add(c);
        }
        return cubics;
    }


    Float lineX = null;

    Integer temp = null;

    @Override
    public boolean onTouch(View v, MotionEvent event) {
        getParent().requestDisallowInterceptTouchEvent(true);
        switch(event.getAction()){
            case MotionEvent.ACTION_DOWN:
            case MotionEvent.ACTION_MOVE:
                float zhi = (event.getX()-gridX)%xSpace;
                boolean fanwei = zhi>0&&zhi0&&fanwei&&event.getX()
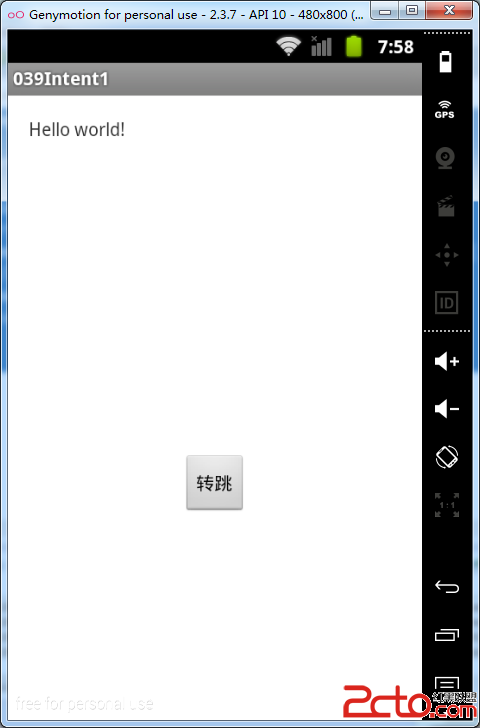 從零開始學android(Intent初步.四十.)
Intent意圖是android中非常重要的部分,他在Activity,service中有較為廣泛的應用。 1 public void startActiv
 Android開發技巧——使用PopupWindow實現彈出菜單
在本文當中,我將會與大家分享一個封裝了PopupWindow實現彈出菜單的類,並說明它的實現與使用。 因對界面的需求,android原生的彈出菜單已不能滿足我們的需求,自
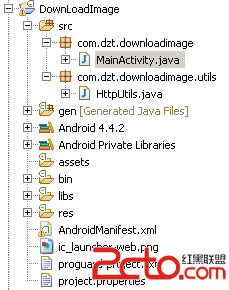 Android使用HttpURLConnection下載圖片
講到http就必需要了解URI和URL URI (uniform resource identifier)統一資源標志符; URL(uniform resource lo
 Android 超高仿微信圖片選擇器 圖片該這麼加載
1、概述 關於手機圖片加載器,在當今像素隨隨便便破千萬的時代,一張圖片占據的內存都相當可觀,作為高大尚程序猿的我們,有必要掌握圖片的壓縮,緩存等處理,以到達