編輯:關於Android編程
緒論
轉眼間,2016伴隨著互聯網寒冬和帝都的霧霾馬上就過去了,不知道大家今年一整年過得怎麼樣?最近票圈被各個城市的霧霾刷屏,內心難免會動蕩,慶幸自己早出來一年,也擔憂著自己的未來的職業規劃。無所謂了,既然選擇了這個行業,我覺得大家就應該堅持下去,路是自己走的,及時再寒冬,只要你足夠優秀,足夠努力,相信你最後還是會找到自己滿意的工作的。最後還要感謝今年博客之星大家對我的投票支持,非常感謝。不多說了,今天的主題是它–對,自定義View柱狀圖。
先來說說我最近在做什麼吧?好久沒有寫博客了,最近手裡有兩個項目,閒的時候一直在忙著做項目,也封裝了屬於自己的一套Library,抽下來我會把它分享出來的。公司的項目也一直在忙,今天的柱狀圖就是公司的項目所用到的。先來看一下效果吧

具體實現
可以看到,今天的柱狀圖分為三類:雙條豎向柱狀圖、單條豎向柱狀圖以及單條橫向柱狀圖,其實原理都是一樣的,下面我們具體看一下怎麼實現,怎麼去畫一個這樣的柱狀圖。
雙條豎向
我們可以看到這個柱狀圖主要包括下面幾個方面:
好了上面五點就是需求和UI所提出來的所有東西,我們開始著手去“畫”吧。
1.首先我們定義一些資源style供使用
包括
底部和頂部顏色是用於漸變用的
<declare-styleable name="MyChartView">
    <attr name="leftColor" format="color"></attr>
    <attr name="leftColorBottom" format="color"></attr>
    <attr name="selectLeftColor" format="color"></attr>
    <attr name="rightColor" format="color"></attr>
    <attr name="rightColorBottom" format="color"></attr>
    <attr name="selectRightColor" format="color"></attr>
    <attr name="xyColor" format="color"></attr>
  </declare-styleable>
2.接下來我們看具體代碼,注釋寫的很詳細了,仔細看:
注意:onWindowVisibilityChanged這個方法(當屏幕焦點變化時重新側向起始位置,必須重寫次方法,否則當焦點變化時柱狀圖會跑到屏幕外面)
下面主要說一下繪制部分吧
OnDraw()部分
我們將每次onTouch的條的索引放到selectIndexRoles數組中,然後當這個數組包含該繪制的柱狀圖的索引是我們設置不用顏色以及不設置漸變;
同時我們給每兩個雙條之間的的空白處繪制成陰影;
最後drawRoundRect()就繪制了一個圓角的矩形。
//畫柱狀圖
    for (int i = 0; i < list.size(); i++) {
      int size = mHeight / 120;
      if (selectIndexRoles.contains(i)) {
        //偶數
        mChartPaint.setShader(null);
        if (i % 2 == 0) {
          mChartPaint.setColor(selectLeftColor);
        } else {
          mChartPaint.setColor(selectRightColor);
        }
      } else {
        //偶數
        if (i % 2 == 0) {
          LinearGradient lg = new LinearGradient(mChartWidth, mChartWidth + mSize, mHeight - 100,
            (float) (mHeight - 100 - list.get(i) * size), lefrColorBottom, leftColor, Shader.TileMode.MIRROR);
          mChartPaint.setShader(lg);
        } else {
          LinearGradient lg = new LinearGradient(mChartWidth, mChartWidth + mSize, mHeight - 100,
            (float) (mHeight - 100 - list.get(i) * size), rightColorBottom, rightColor, Shader.TileMode.MIRROR);
          mChartPaint.setShader(lg);
        }
      }

      mChartPaint.setStyle(Paint.Style.FILL);
      //畫陰影
      if (i == number * 2 || i == number * 2 + 1) {
        mShadowPaint.setColor(Color.BLUE);
      } else {
        mShadowPaint.setColor(Color.WHITE);
      }

      //畫柱狀圖
      RectF rectF = new RectF();
      rectF.left = mChartWidth;
      rectF.right = mChartWidth + mSize;
      rectF.bottom = mHeight - 100;
      rectF.top = (float) (mHeight - 100 - list.get(i) * size);
      canvas.drawRoundRect(rectF, 10, 10, mChartPaint);
      //canvas.drawRect(mChartWidth, mHeight - 100 - list.get(i) * size, mChartWidth + mSize, mHeight - 100, mChartPaint)
      // ;// 長方形
      mChartWidth += (i % 2 == 0) ? (3 + getWidth() / 39) : (getWidth() / 13 - 3 - mSize);
    }
全部代碼
package com.hankkin.mycartdemo.chatview;

import android.content.Context;
import android.content.res.TypedArray;
import android.graphics.Canvas;
import android.graphics.Color;
import android.graphics.LinearGradient;
import android.graphics.Paint;
import android.graphics.Rect;
import android.graphics.RectF;
import android.graphics.Shader;
import android.util.AttributeSet;
import android.view.MotionEvent;
import android.view.View;
import com.hankkin.mycartdemo.R;
import java.util.ArrayList;
import java.util.List;

/**
 * Created by Hankkin on 2016/12/10.
 */

public class MyChartView extends View {

  private int leftColor;//雙柱左側
  private int rightColor;//雙柱右側
  private int lineColor;//橫軸線
  private int selectLeftColor;//點擊選中左側
  private int selectRightColor;//點擊選中右側
  private int lefrColorBottom;//左側底部
  private int rightColorBottom;//右側底部
  private Paint mPaint, mChartPaint, mShadowPaint;//橫軸畫筆、柱狀圖畫筆、陰影畫筆
  private int mWidth, mHeight, mStartWidth, mChartWidth, mSize;//屏幕寬度高度、柱狀圖起始位置、柱狀圖寬度
  private Rect mBound;
  private List<Float> list = new ArrayList<>();//柱狀圖高度占比
  private Rect rect;//柱狀圖矩形
  private getNumberListener listener;//點擊接口
  private int number = 1000;//柱狀圖最大值
  private int selectIndex = -1;//點擊選中柱狀圖索引
  private List<Integer> selectIndexRoles = new ArrayList<>();

  public void setList(List<Float> list) {
    this.list = list;
    mSize = getWidth() / 39;
    mStartWidth = getWidth() / 13;
    mChartWidth = getWidth() / 13 - mSize - 3;
    invalidate();
  }

  public void setListener(getNumberListener listener) {
    this.listener = listener;
  }

  public MyChartView(Context context) {
    this(context, null);
  }

  public MyChartView(Context context, AttributeSet attrs) {
    this(context, attrs, 0);
  }

  public MyChartView(Context context, AttributeSet attrs, int defStyleAttr) {
    super(context, attrs, defStyleAttr);
    //獲取我們自定義的樣式屬性
    TypedArray array = context.getTheme().obtainStyledAttributes(attrs, R.styleable.MyChartView, defStyleAttr, 0);
    int n = array.getIndexCount();
    for (int i = 0; i < n; i++) {
      int attr = array.getIndex(i);
      switch (attr) {
        case R.styleable.MyChartView_leftColor:
          // 默認顏色設置為黑色
          leftColor = array.getColor(attr, Color.BLACK);
          break;
        case R.styleable.MyChartView_selectLeftColor:
          // 默認顏色設置為黑色
          selectLeftColor = array.getColor(attr, Color.BLACK);
          break;
        case R.styleable.MyChartView_rightColor:
          rightColor = array.getColor(attr, Color.BLACK);
          break;
        case R.styleable.MyChartView_selectRightColor:
          selectRightColor = array.getColor(attr, Color.BLACK);
          break;
        case R.styleable.MyChartView_xyColor:
          lineColor = array.getColor(attr, Color.BLACK);
          break;
        case R.styleable.MyChartView_leftColorBottom:
          lefrColorBottom = array.getColor(attr, Color.BLACK);
          break;
        case R.styleable.MyChartView_rightColorBottom:
          rightColorBottom = array.getColor(attr, Color.BLACK);
          break;
      }
    }
    array.recycle();
    init();
  }

  //初始化畫筆
  private void init() {
    mPaint = new Paint();
    mPaint.setAntiAlias(true);
    mBound = new Rect();
    mChartPaint = new Paint();
    mChartPaint.setAntiAlias(true);
    mShadowPaint = new Paint();
    mShadowPaint.setAntiAlias(true);
    mShadowPaint.setColor(Color.WHITE);
  }

  //測量高寬度
  @Override
  protected void onMeasure(int widthMeasureSpec, int heightMeasureSpec) {
    super.onMeasure(widthMeasureSpec, heightMeasureSpec);
    int width;
    int height;
    int widthSize = MeasureSpec.getSize(widthMeasureSpec);
    int heightSize = MeasureSpec.getSize(heightMeasureSpec);
    int widthMode = MeasureSpec.getMode(widthMeasureSpec);
    int heightMode = MeasureSpec.getMode(heightMeasureSpec);

    if (widthMode == MeasureSpec.EXACTLY) {
      width = widthSize;
    } else {
      width = widthSize * 1 / 2;
    }
    if (heightMode == MeasureSpec.EXACTLY) {
      height = heightSize;
    } else {
      height = heightSize * 1 / 2;
    }

    setMeasuredDimension(width, height);
  }

  //計算高度寬度
  @Override
  protected void onLayout(boolean changed, int left, int top, int right, int bottom) {
    super.onLayout(changed, left, top, right, bottom);
    mWidth = getWidth();
    mHeight = getHeight();
    mStartWidth = getWidth() / 13;
    mSize = getWidth() / 39;
    mChartWidth = getWidth() / 13 - mSize;
  }

  //重寫onDraw繪制
  @Override
  protected void onDraw(Canvas canvas) {
    super.onDraw(canvas);

    mPaint.setColor(lineColor);
    //畫坐標軸
    //canvas.drawLine(0, mHeight - 100, mWidth, mHeight - 100, mPaint);
    for (int i = 0; i < 12; i++) {
      //畫刻度線
      //canvas.drawLine(mStartWidth, mHeight - 100, mStartWidth, mHeight - 80, mPaint);
      //畫數字
      mPaint.setTextSize(35);
      mPaint.setTextAlign(Paint.Align.CENTER);
      mPaint.getTextBounds(String.valueOf(i + 1) + "", 0, String.valueOf(i).length(), mBound);
      canvas.drawText(String.valueOf(i + 1) + "月", mStartWidth - mBound.width() * 1 / 2,
        mHeight - 60 + mBound.height() * 1 / 2, mPaint);
      mStartWidth += getWidth() / 13;
    }
    //畫柱狀圖
    for (int i = 0; i < list.size(); i++) {
      int size = mHeight / 120;
      if (selectIndexRoles.contains(i)) {
        //偶數
        mChartPaint.setShader(null);
        if (i % 2 == 0) {
          mChartPaint.setColor(selectLeftColor);
        } else {
          mChartPaint.setColor(selectRightColor);
        }
      } else {
        //偶數
        if (i % 2 == 0) {
          LinearGradient lg = new LinearGradient(mChartWidth, mChartWidth + mSize, mHeight - 100,
            (float) (mHeight - 100 - list.get(i) * size), lefrColorBottom, leftColor, Shader.TileMode.MIRROR);
          mChartPaint.setShader(lg);
        } else {
          LinearGradient lg = new LinearGradient(mChartWidth, mChartWidth + mSize, mHeight - 100,
            (float) (mHeight - 100 - list.get(i) * size), rightColorBottom, rightColor, Shader.TileMode.MIRROR);
          mChartPaint.setShader(lg);
        }
      }

      mChartPaint.setStyle(Paint.Style.FILL);
      //畫陰影
      if (i == number * 2 || i == number * 2 + 1) {
        mShadowPaint.setColor(Color.BLUE);
      } else {
        mShadowPaint.setColor(Color.WHITE);
      }

      //畫柱狀圖
      RectF rectF = new RectF();
      rectF.left = mChartWidth;
      rectF.right = mChartWidth + mSize;
      rectF.bottom = mHeight - 100;
      rectF.top = (float) (mHeight - 100 - list.get(i) * size);
      canvas.drawRoundRect(rectF, 10, 10, mChartPaint);
      //canvas.drawRect(mChartWidth, mHeight - 100 - list.get(i) * size, mChartWidth + mSize, mHeight - 100, mChartPaint)
      // ;// 長方形
      mChartWidth += (i % 2 == 0) ? (3 + getWidth() / 39) : (getWidth() / 13 - 3 - mSize);
    }
  }

  @Override
  public void onWindowFocusChanged(boolean hasWindowFocus) {
    super.onWindowFocusChanged(hasWindowFocus);
    if (hasWindowFocus) {

    }
  }

  /**
   * 注意:
   * 當屏幕焦點變化時重新側向起始位置,必須重寫次方法,否則當焦點變化時柱狀圖會跑到屏幕外面
   */

  @Override
  protected void onWindowVisibilityChanged(int visibility) {
    super.onWindowVisibilityChanged(visibility);
    if (visibility == VISIBLE) {
      mSize = getWidth() / 39;
      mStartWidth = getWidth() / 13;
      mChartWidth = getWidth() / 13 - mSize - 3;
    }
  }

  /**
   * 柱狀圖touch事件
   * 獲取觸摸位置計算屬於哪個月份的
   * @param ev
   * @return
   */
  @Override
  public boolean onTouchEvent(MotionEvent ev) {

    int x = (int) ev.getX();
    int y = (int) ev.getY();
    int left = 0;
    int top = 0;
    int right = mWidth / 12;
    int bottom = mHeight - 100;
    switch (ev.getAction()) {
      case MotionEvent.ACTION_DOWN:
        for (int i = 0; i < 12; i++) {
          rect = new Rect(left, top, right, bottom);
          left += mWidth / 12;
          right += mWidth / 12;
          if (rect.contains(x, y)) {
            listener.getNumber(i, x, y);
            number = i;
            selectIndex = i;
            selectIndexRoles.clear();
            ;
            selectIndexRoles.add(selectIndex * 2 + 1);
            selectIndexRoles.add(selectIndex * 2);
            invalidate();
          }
        }
        break;
      case MotionEvent.ACTION_UP:

        break;
    }
    return true;
  }

  public interface getNumberListener {
    void getNumber(int number, int x, int y);
  }

  public int getLeftColor() {
    return leftColor;
  }

  public void setLeftColor(int leftColor) {
    this.leftColor = leftColor;
  }

  public int getRightColor() {
    return rightColor;
  }

  public void setRightColor(int rightColor) {
    this.rightColor = rightColor;
  }

  public int getLineColor() {
    return lineColor;
  }

  public void setLineColor(int lineColor) {
    this.lineColor = lineColor;
  }

  public int getSelectLeftColor() {
    return selectLeftColor;
  }

  public void setSelectLeftColor(int selectLeftColor) {
    this.selectLeftColor = selectLeftColor;
  }

  public int getSelectRightColor() {
    return selectRightColor;
  }

  public void setSelectRightColor(int selectRightColor) {
    this.selectRightColor = selectRightColor;
  }

  public int getLefrColorBottom() {
    return lefrColorBottom;
  }

  public void setLefrColorBottom(int lefrColorBottom) {
    this.lefrColorBottom = lefrColorBottom;
  }

  public int getRightColorBottom() {
    return rightColorBottom;
  }

  public void setRightColorBottom(int rightColorBottom) {
    this.rightColorBottom = rightColorBottom;
  }
}
3.具體使用:
private void initChatView() {

    myChartView.setLefrColorBottom(getResources().getColor(R.color.leftColorBottom));
    myChartView.setLeftColor(getResources().getColor(R.color.leftColor));
    myChartView.setRightColor(getResources().getColor(R.color.rightColor));
    myChartView.setRightColorBottom(getResources().getColor(R.color.rightBottomColor));
    myChartView.setSelectLeftColor(getResources().getColor(R.color.selectLeftColor));
    myChartView.setSelectRightColor(getResources().getColor(R.color.selectRightColor));
    myChartView.setLineColor(getResources().getColor(R.color.xyColor));
    chartList = new ArrayList<>();

    relativeLayout = (RelativeLayout) findViewById(R.id.linearLayout);
    relativeLayout.removeView(llChart);
    Random random = new Random();
    while (chartList.size() < 24) {
      int randomInt = random.nextInt(100);
      chartList.add((float) randomInt);
    }
    myChartView.setList(chartList);
    myChartView.setListener(new MyChartView.getNumberListener() {
      @Override
      public void getNumber(int number, int x, int y) {
        relativeLayout.removeView(llChart);
        //反射加載點擊柱狀圖彈出布局
        llChart = (LinearLayout) LayoutInflater.from(MainActivity.this).inflate(R.layout.layout_shouru_zhichu, null);
        TextView tvZhichu = (TextView) llChart.findViewById(R.id.tv_zhichu);
        TextView tvShouru = (TextView) llChart.findViewById(R.id.tv_shouru);
        tvZhichu.setText((number + 1) + "月支出" + " " + chartList.get(number * 2));
        tvShouru.setText ( "收入: " + chartList.get(number * 2 + 1));
        llChart.measure(0, 0);//調用該方法後才能獲取到布局的寬度
        RelativeLayout.LayoutParams params = new RelativeLayout.LayoutParams(RelativeLayout.LayoutParams.WRAP_CONTENT,
          RelativeLayout.LayoutParams.WRAP_CONTENT);
        params.leftMargin = x - 100;
        if (x - 100 < 0) {
          params.leftMargin = 0;
        } else if (x - 100 > relativeLayout.getWidth() - llChart.getMeasuredWidth()) {
          //設置布局距左側屏幕寬度減去布局寬度
          params.leftMargin = relativeLayout.getWidth() - llChart.getMeasuredWidth();
        }
        llChart.setLayoutParams(params);
        relativeLayout.addView(llChart);
      }
    });
  }
經過以上步驟,我們的雙條豎向柱狀圖就繪制完成了,也顯示出來了。其實自己坐下來仔細拿筆算一下,畫一下,也沒有想象的那麼難。至於單條和橫向的實現原理都一樣,比這個要簡單的多。哦對了,橫向的我只是自定義了一個橫向的柱狀圖View,然後用ListView顯示的各個部門的具體內容。
代碼下載:demo
以上就是本文的全部內容,希望對大家的學習有所幫助,也希望大家多多支持本站。
 自定義View 之利用ViewPager 實現畫廊效果(滑動放大縮小)
基本介紹畫廊在很多的App設計中都有,如下圖所示:該例子是我沒事的時候寫的一個小項目,具體源碼地址請訪問https://github.com/AlexSmille/Yin
 Android開發 二 IPC機制(下)
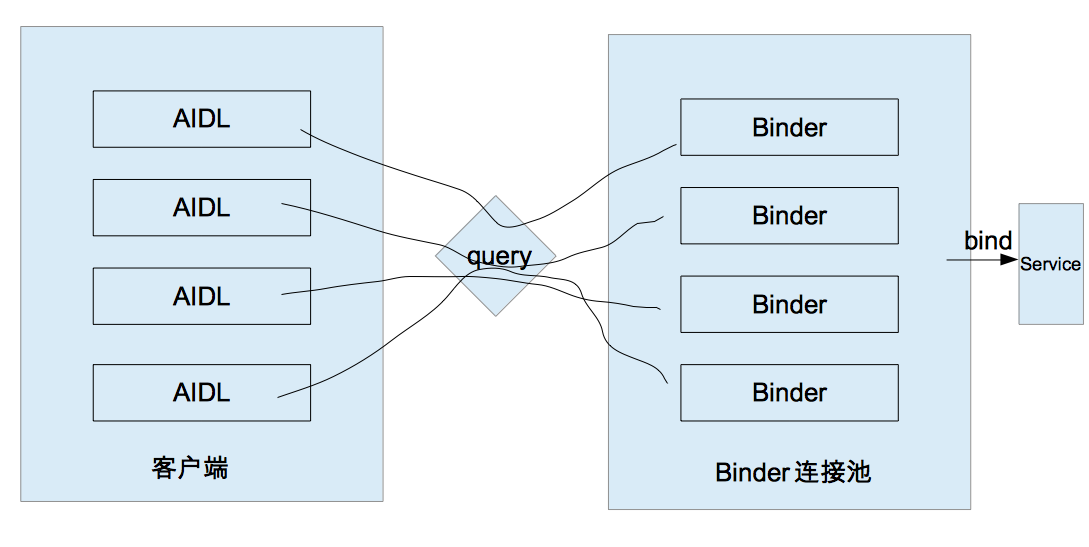
我們繼續來講IPC機制,在本篇中你將會學習到ContentProvider Socket Binder連接池一.使用ContentProvider ContentPro
 Android-2電話應用,短信應用
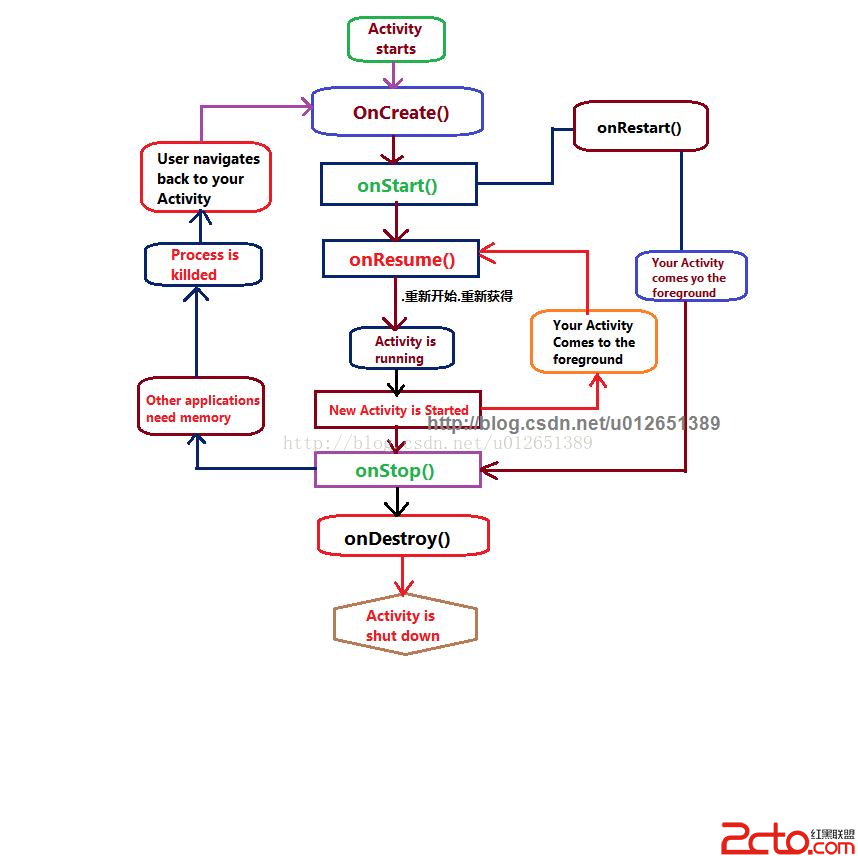
Activity的生命周期 Android的核心組件 1.Viiew :界面 ,組織UI控件 2.Intent :意圖,支持組件之間的通信 3.Activity:
 Android使用音頻信息繪制動態波紋
在一些音樂類應用中, 經常會展示隨著節奏上下起伏的波紋信息, 這些波紋形象地傳達了聲音信息, 可以提升用戶體驗, 那麼是如何實現的呢? 可以使用Visualize