編輯:關於android開發
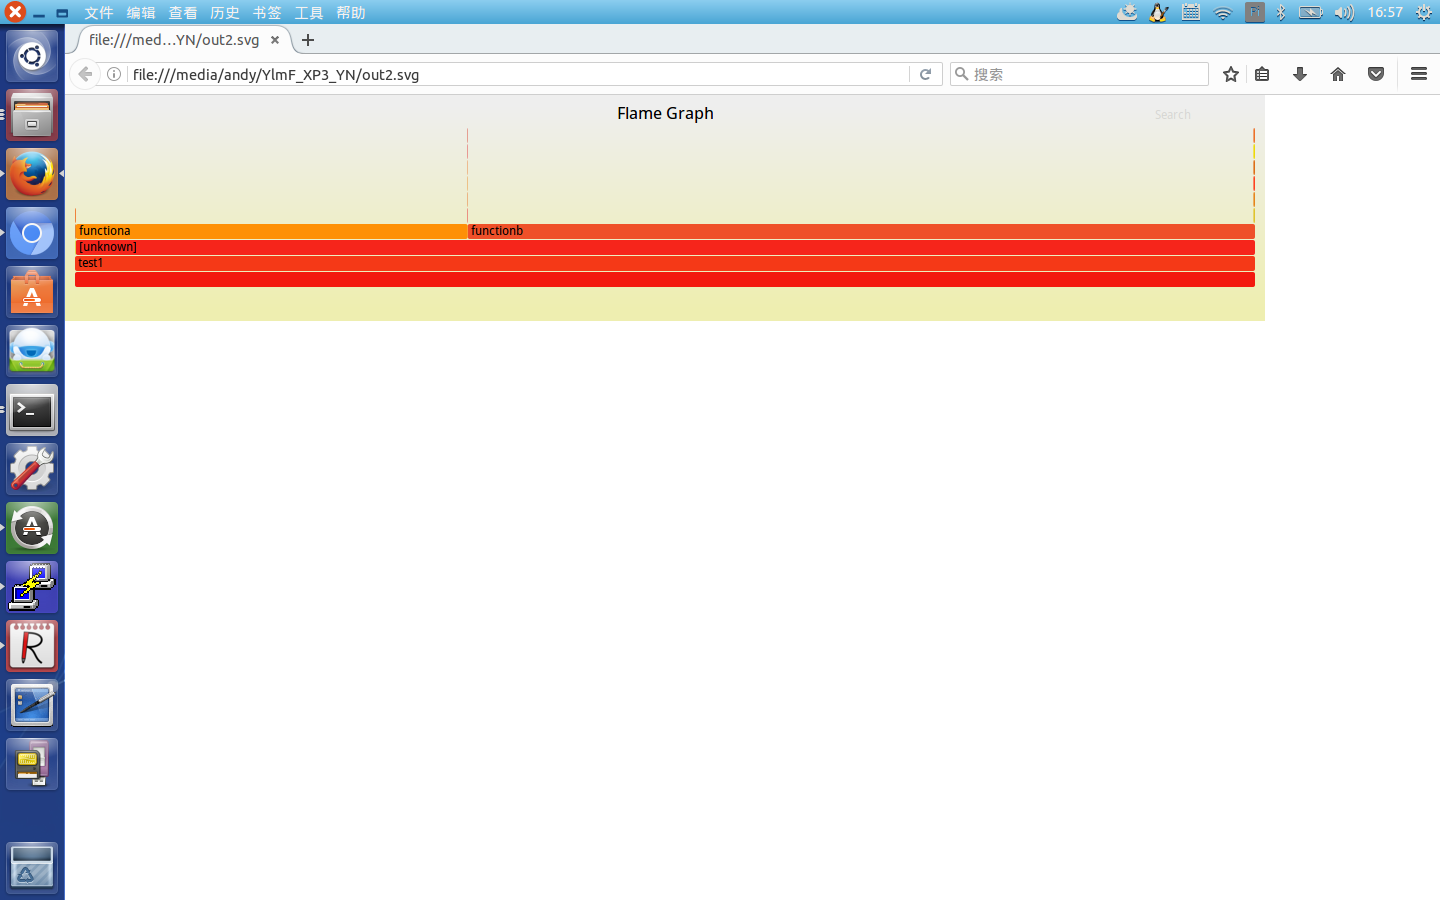
perf 有一個功能就是按一定頻率采集某一個程序的調用棧,然後對調用棧進行統計分析。如果某一個代碼路徑在采集結果中出現的越平凡,說明程序消耗在這個代碼路徑上的時間也就越多。這樣我們就能很快找到程序調用最頻繁的代碼路徑。
perf record -F 99 -p $(pidof test1) -g -- sleep 300這個命令是采集test1程序相關的調用棧,采樣頻率為99Hz,-g表示將調用棧打印出來,-- sleep 30表示采樣時間是300秒
perf report -g --stdio這個命令是查看采用的結果
為了了解這個工具有什麼樣的作用,我特意寫了一個程序來進行分析。
#includeint functiona(void){ int c = 0; int count = 0; for(c = 1; c < 20000; c++) { count++; } return;}int functionb(void){ int c = 0; int count = 0; for(c = 1; c < 40000; c++) { count++; } return;}int main(int argc, char * argv[]){ for(;;) { functiona(); printf("call function a\n"); functionb(); printf("call function b\n"); } return;}通過編譯命令gcc -g -o test1 test1.c
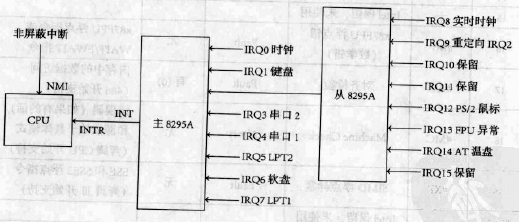 Linux內核系列—8.操作系統開發之時鐘中斷,linux內核
Linux內核系列—8.操作系統開發之時鐘中斷,linux內核外部中斷的情況復雜一些,因為需要建立硬件中斷與向量號之間的對應關系。外部中斷分為不可屏蔽中斷(NMI)和可屏
 我的android學習經歷8,android學習經歷8
我的android學習經歷8,android學習經歷8android簽名打包apk文件 1.在要打包的項目上右擊打開Android Tools,然後打開Export An
 linux2.4.18----25.文件系統的構建
linux2.4.18----25.文件系統的構建一. 文件系統的構建1.busybox的編譯方法: 用虛擬機的redhat9.0進行編譯版本: busybox-1.00
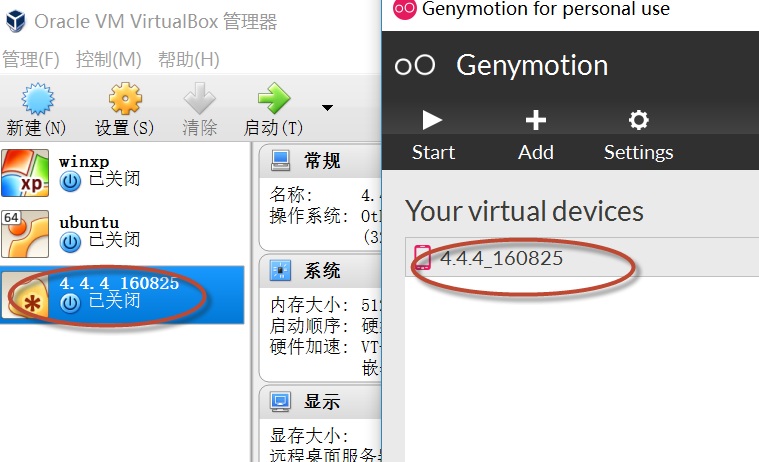 關於Genymotion下載比較慢的解決辦法,genymotion解決辦法
關於Genymotion下載比較慢的解決辦法,genymotion解決辦法 Genymotion號稱Android模擬器中運行最快的,但是服務器在國外,Android鏡